前端工作中有一部分大屏需求:


这种大屏都是和地图相关的。
那我们如何画出这种地图呢?
考虑下:如果单拿出某个省的形状来,怎么画?
很明显,用 Shape 就行,把一堆二维坐标的点连起来。
然后用 ShapeGeometry 画出形状几何体,或者用 ExtrudeGeometry 拉伸一下。
那问题来了,从哪里拿到这些形状数据呢?
这种地图相关的形状数据有一个 geojson 的标准。
比如这个 geojson:
https://geo.datav.aliyun.com/areas_v3/bound/100000_full.json
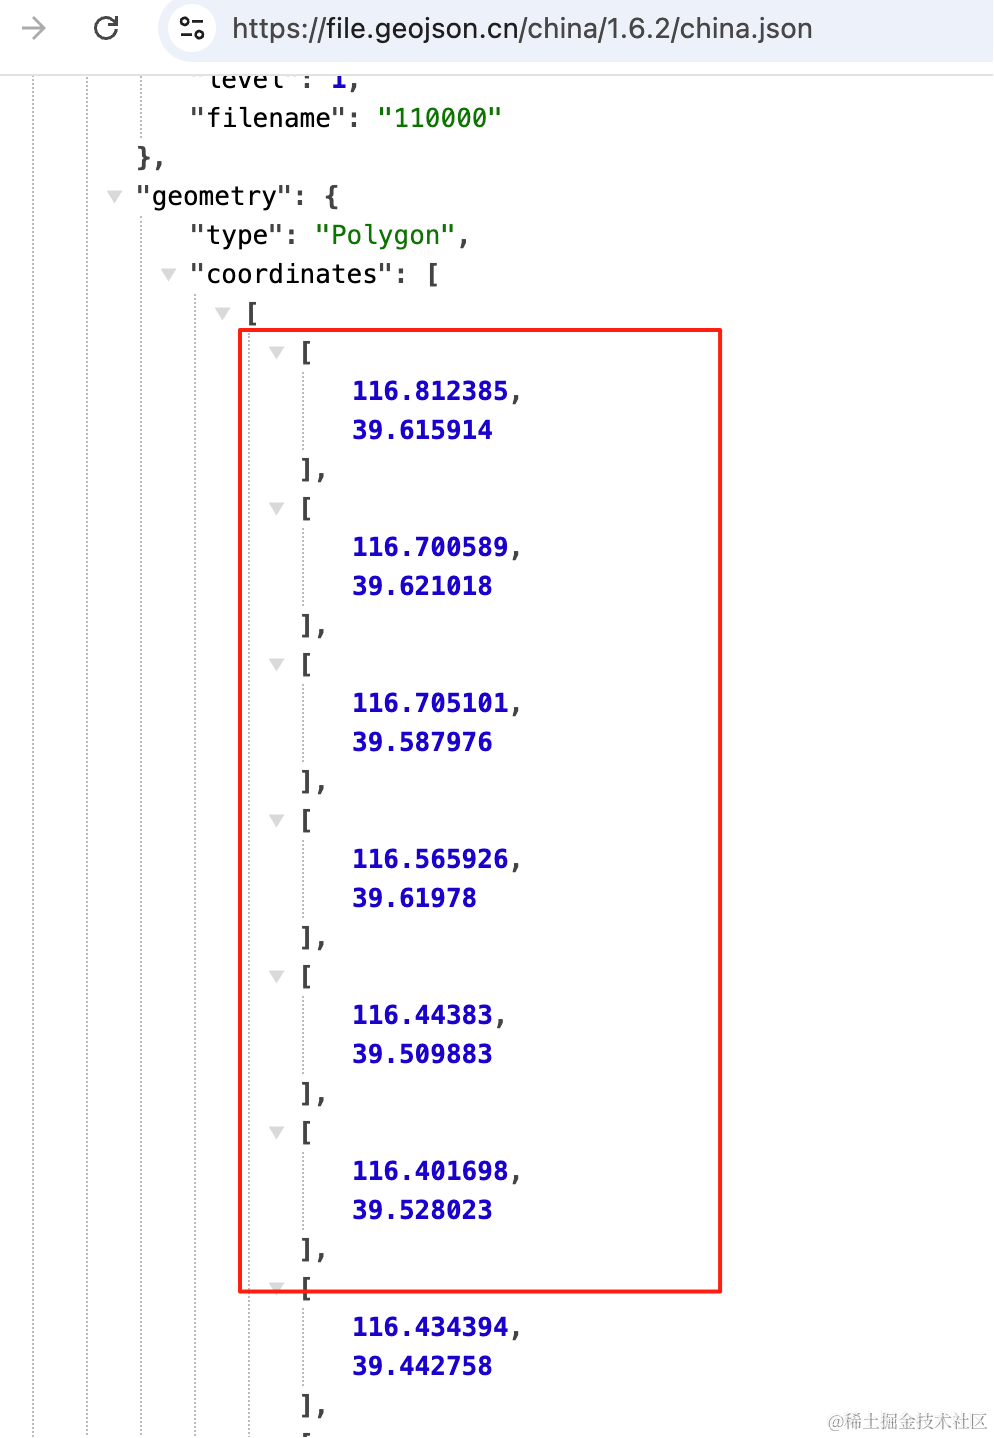
通过这些二维的坐标点,就可以把这个省的地图形状画出来。
但这些坐标其实是经纬度,需要用一种叫墨卡托投影的算法转为平面坐标才能用。
我们来画一下:
npx create-vite geojson-map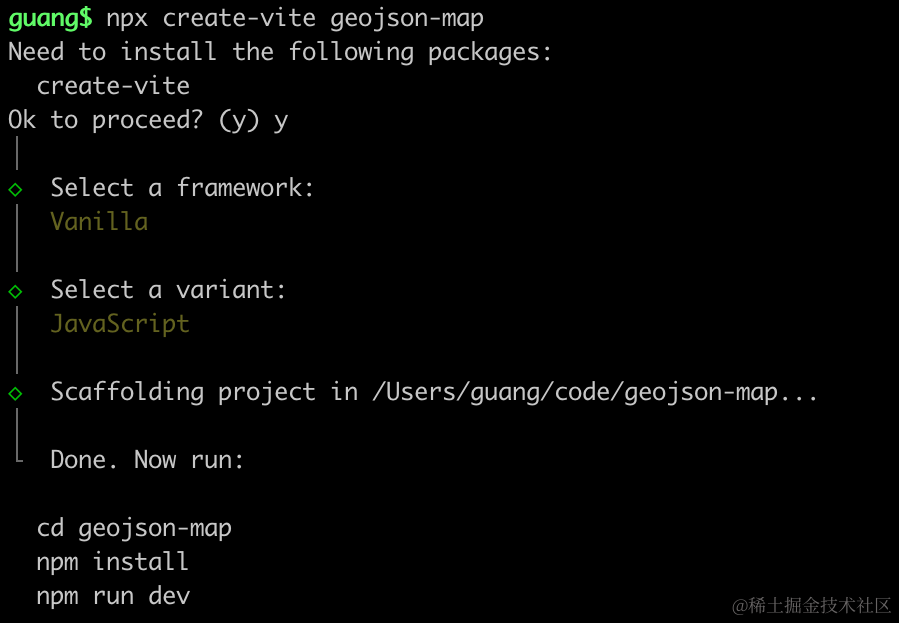
创建项目,进入项目,安装依赖:
pnpm install
pnpm install --save three
pnpm install --save-dev @types/three
改下 src/main.js
import './style.css';
import * as THREE from 'three';
import {
    OrbitControls
} from 'three/addons/controls/OrbitControls.js';
import mesh from './mesh.js';

const scene = new THREE.Scene();

scene.add(mesh);

const light = new THREE.DirectionalLight(0xffffff);
light.position.set(500, 300, 600);
scene.add(light);

const light2 = new THREE.AmbientLight();
scene.add(light2);

const axesHelper = new THREE.AxesHelper(1000);
scene.add(axesHelper);

const width = window.innerWidth;
const height = window.innerHeight;

const camera = new THREE.PerspectiveCamera(60, width / height, 1, 10000);
camera.position.set(0, 500, 500);
camera.lookAt(0, 0, 0);

const renderer = new THREE.WebGLRenderer({
  antialias: true
});
renderer.setSize(width, height)

function render() {
    renderer.render(scene, camera);
    requestAnimationFrame(render);
}

render();

document.body.append(renderer.domElement);

const controls = new OrbitControls(camera, renderer.domElement);
创建 Scene、Light、Camera、Renderer
改下 style.css
body {
    margin: 0;
}
然后创建 mesh.js
import * as THREE from 'three';

const shape = new THREE.Shape();
shape.moveTo(100, 10);
shape.lineTo(10, 40);
shape.lineTo(30, 80);
shape.lineTo(60, 40)
shape.lineTo(80, 100);

const geometry = new THREE.ShapeGeometry(shape);

const material = new THREE.MeshLambertMaterial({
    color: new THREE.Color('lightgreen')
});

const mesh = new THREE.Mesh(geometry, material);

export default mesh;
创建一个 Shape 用 ShapeGeometry 画出来。
跑一下:
npm run dev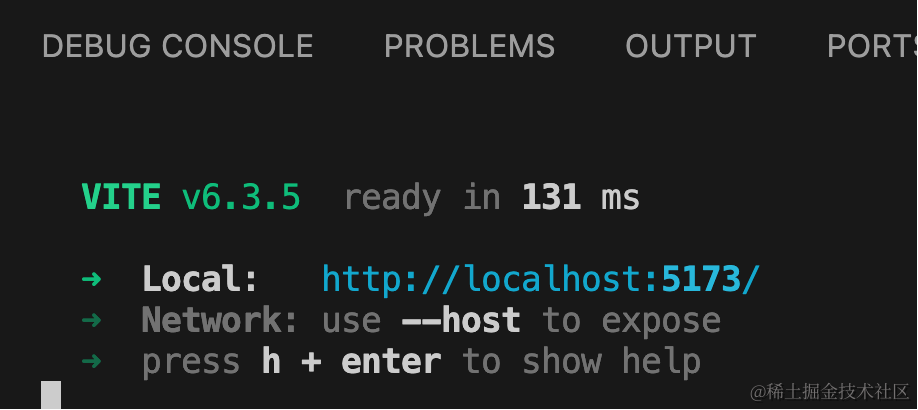
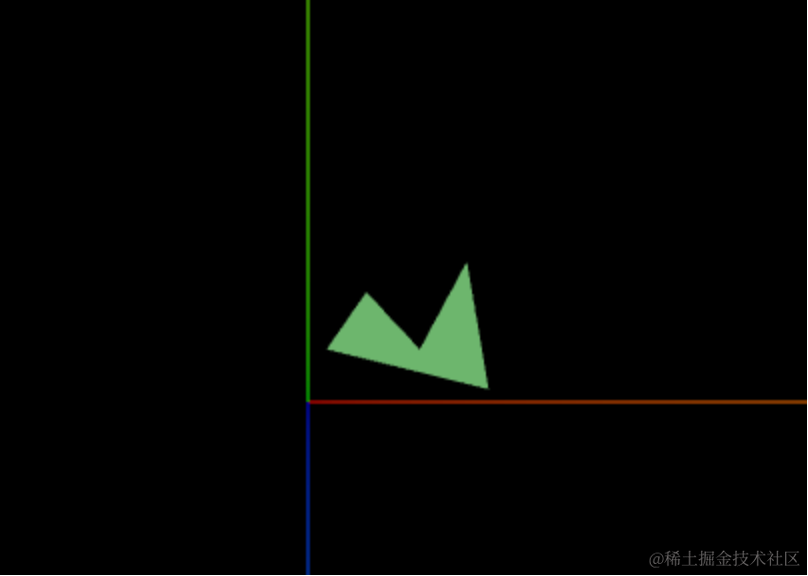
是个这样的形状。
显然,一个省的形状也可以这样画出来。
我们用 geojson 来拿到数据:
https://datav.aliyun.com/portal/school/atlas/area_selector
用 antv 这个工具生成省级的 geojson 数据:
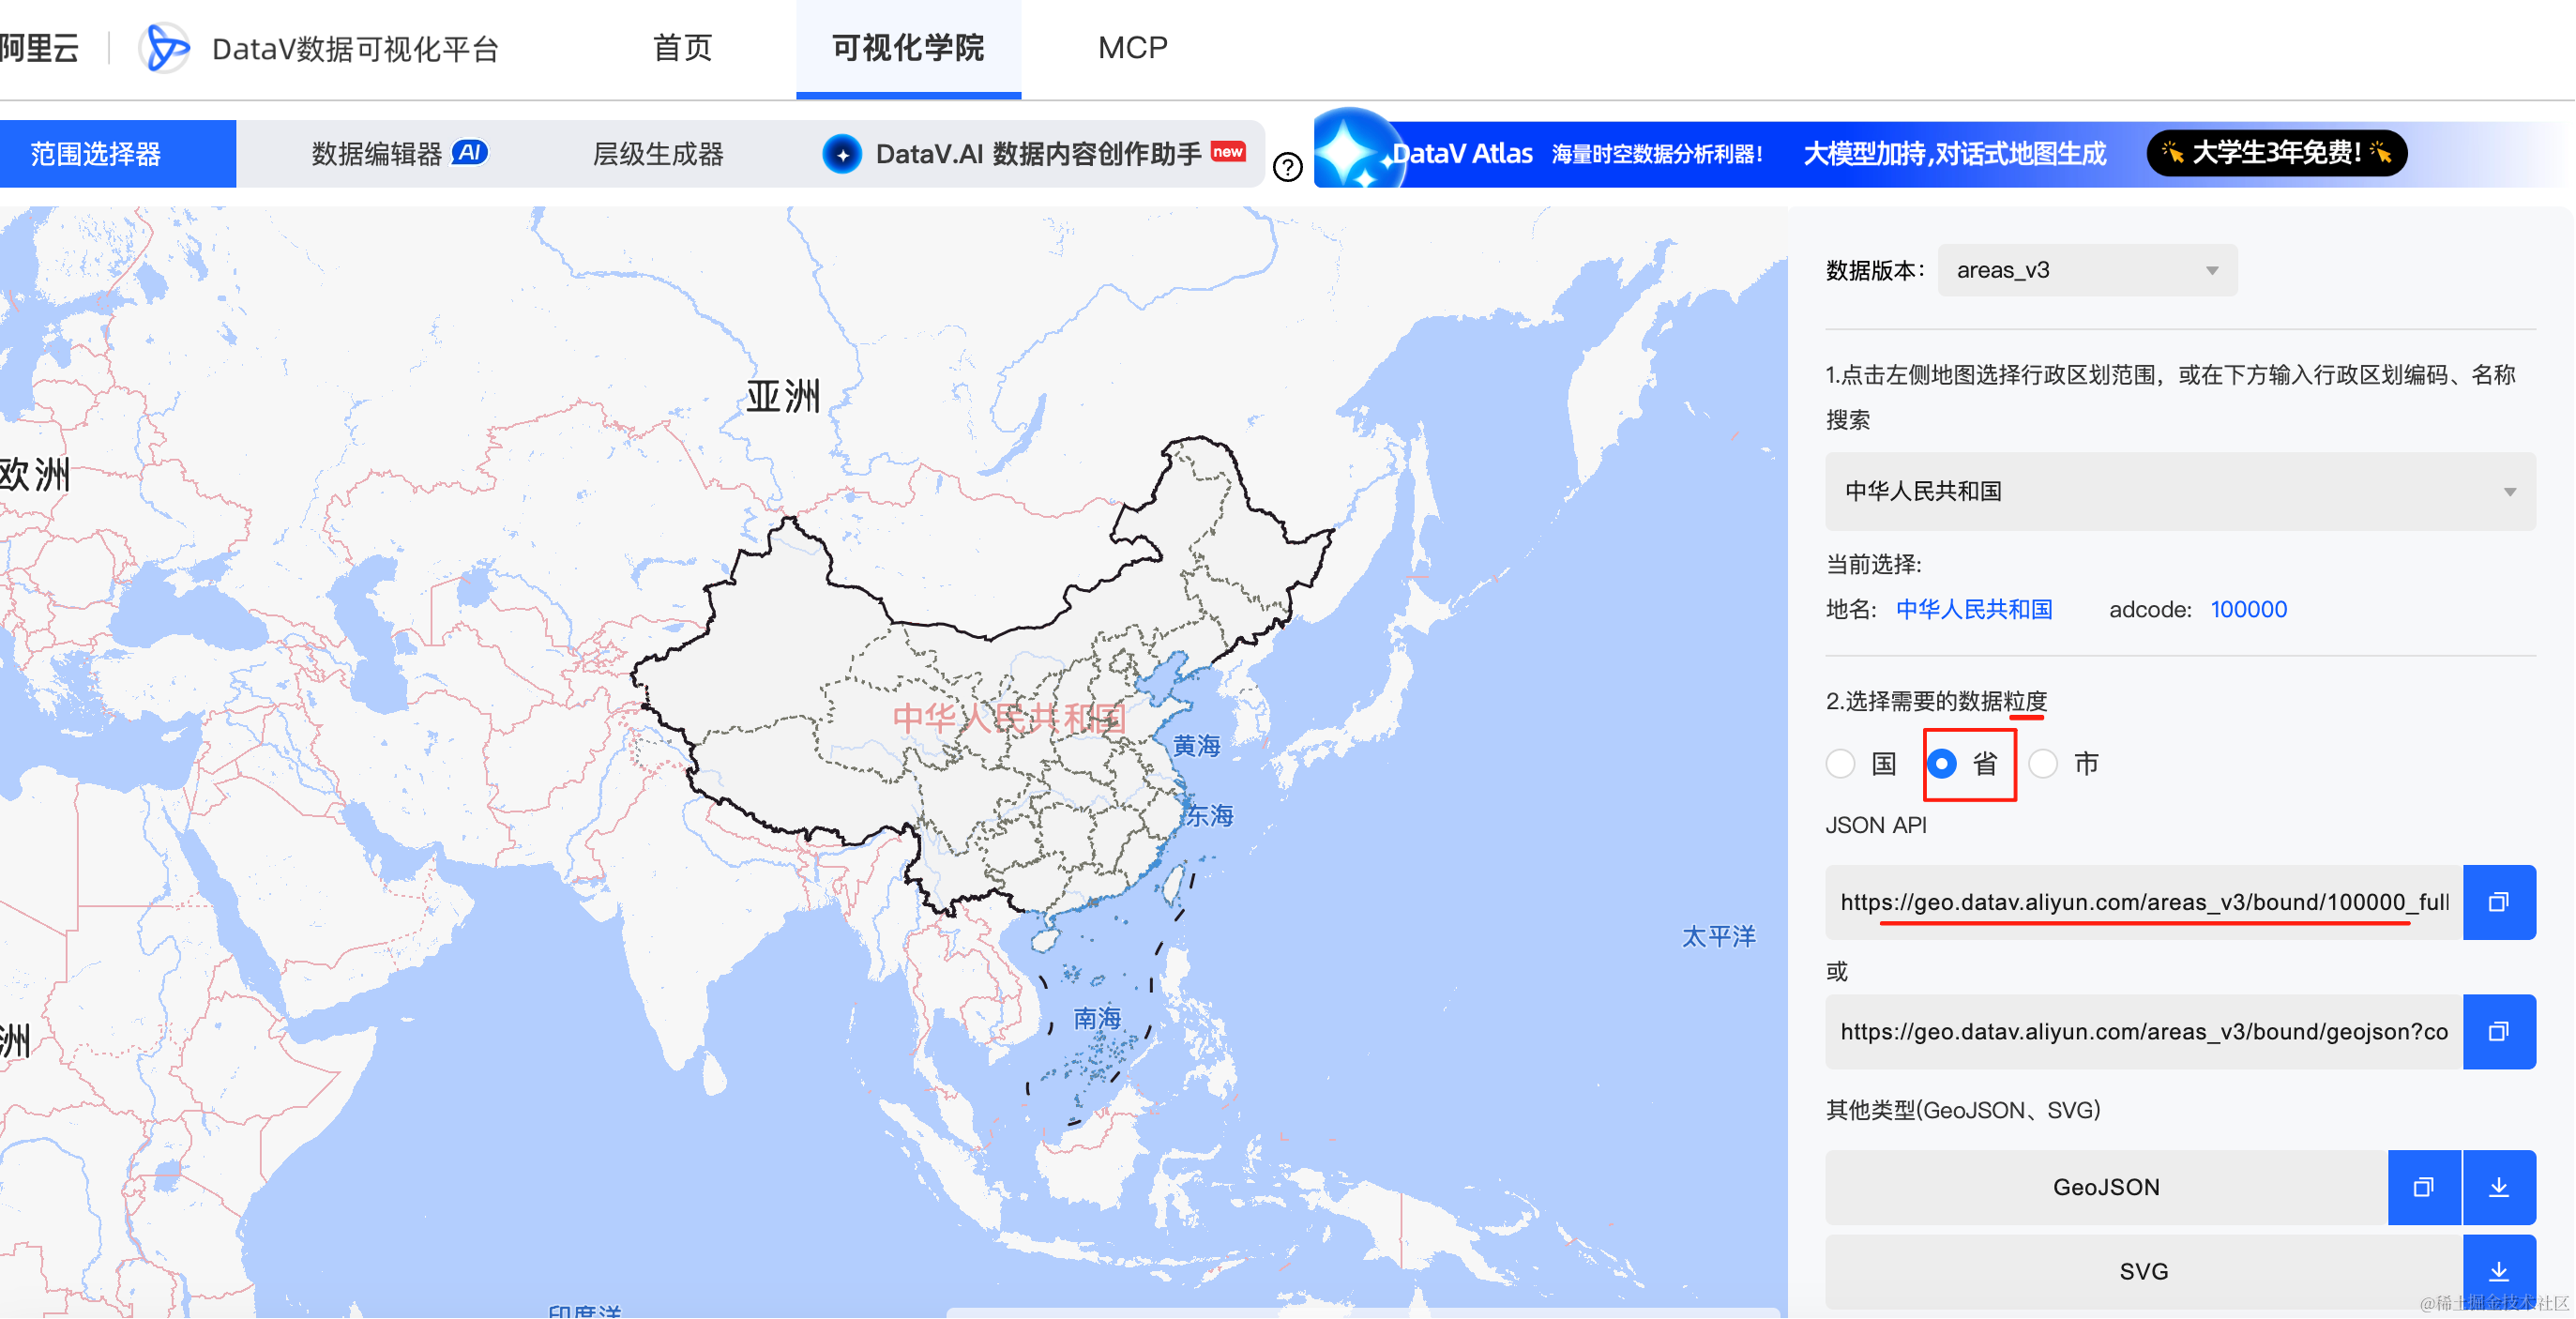
你可以下载 json 到本地或者直接用这个链接。
改下 mesh.js
import * as THREE from 'three';

const chinaMap = new THREE.Group();

const loader = new THREE.FileLoader();
loader.load('https://geo.datav.aliyun.com/areas_v3/bound/100000_full.json', function (data) {
  const geojson = JSON.parse(data);
  console.log(geojson);
});

export default chinaMap;
用 FileLoader 加载这个文件,然后 parse 一样。
这个 FileLoader 其实就和浏览器的 fetch 差不多,用也行,不用直接 fetch 也行。
看下打印的数据:
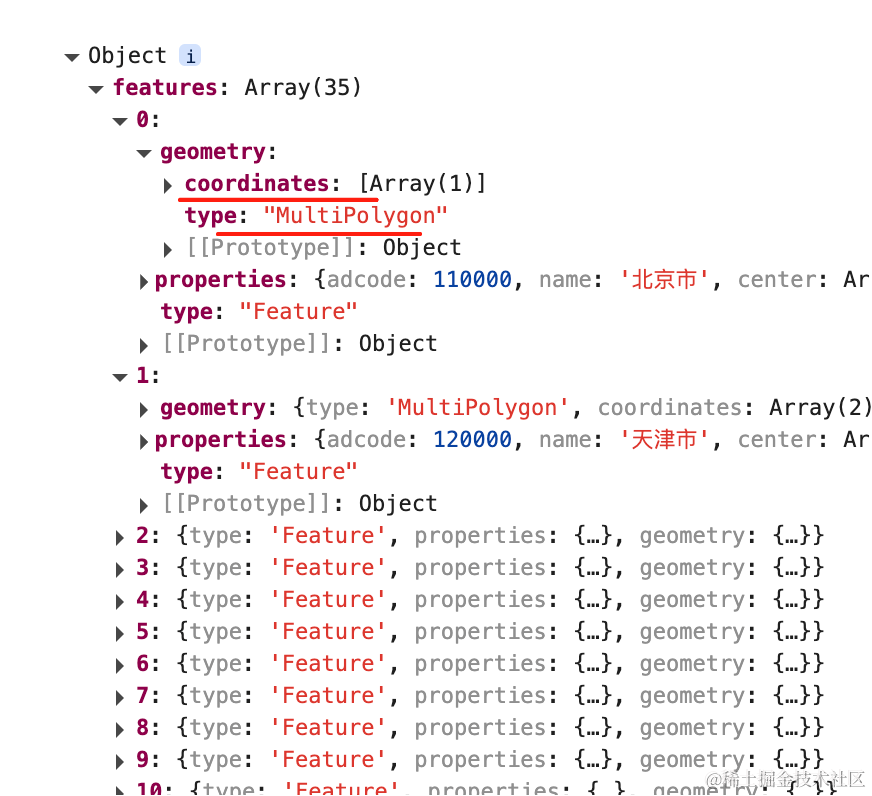
features 下面是每一个省的数据。
MultiPolygon 就是多个多边形,Polygon 是单个多边形。
把这些解析画出来就好了:
coordinates 是经纬度的数组,这里要用墨卡托算法转换为二维坐标。
肯定不是自己写,用 d3-geo 这个包:
pnpm install --save d3-geo
pnpm install --save-dev @types/d3-geo
怎么画呢?
回忆下我们之前创建 BufferGeometry 来画线的代码:
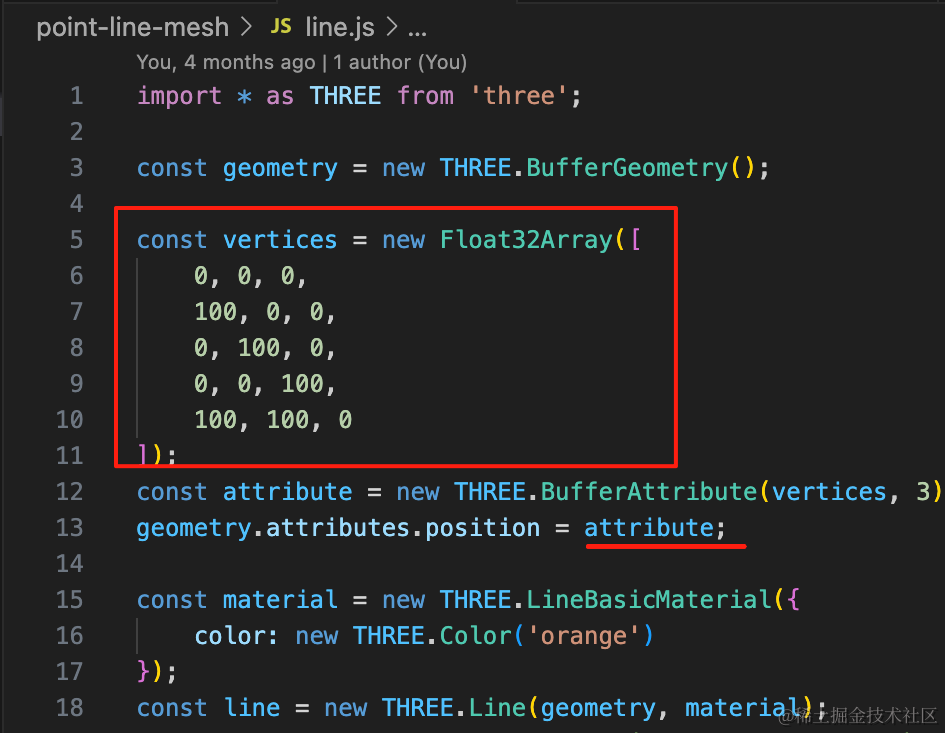
几何体用一堆顶点指定,然后创建线模型。
所以就是这样写:
import * as THREE from 'three';
import { geoMercator } from 'd3-geo';
const chinaMap = new THREE.Group();
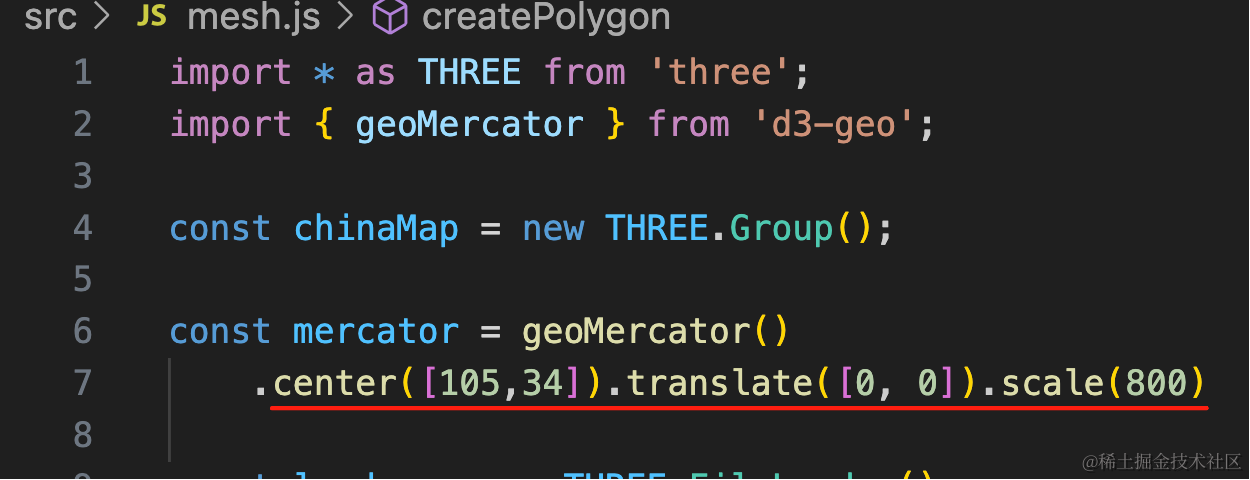
const mercator = geoMercator()
.center([105,34]).translate([0, 0]).scale(800)
const loader = new THREE.FileLoader();
loader.load('https://geo.datav.aliyun.com/areas_v3/bound/100000_full.json', function (data) {
const geojson = JSON.parse(data);
console.log(geojson);
geojson.features.forEach(feature => {
const province = new THREE.Group();
if (feature.geometry.type === 'Polygon') {
const polygon = createPolygon(feature.geometry.coordinates);
province.add(polygon);
} else if (feature.geometry.type === 'MultiPolygon') {
feature.geometry.coordinates.forEach(polygonCoords => {
const polygon = createPolygon(polygonCoords);
province.add(polygon);
});
}
chinaMap.add(province);
});
});
function createPolygon(coordinates) {
const group = new THREE.Group();
coordinates.forEach(item => {
const bufferGeometry = new THREE.BufferGeometry();
const vertices = [];
item.forEach(point => {
const [x, y] = mercator(point);
vertices.push(x, y, 0);
});
const attribute = new THREE.Float32BufferAttribute(vertices, 3);;
bufferGeometry.attributes.position = attribute;
const lineMaterial = new THREE.LineBasicMaterial({
color: 'white'
});
const line = new THREE.Line(bufferGeometry, lineMaterial);
group.add(line);
});
return group;
}
export default chinaMap;一块块来看一下:
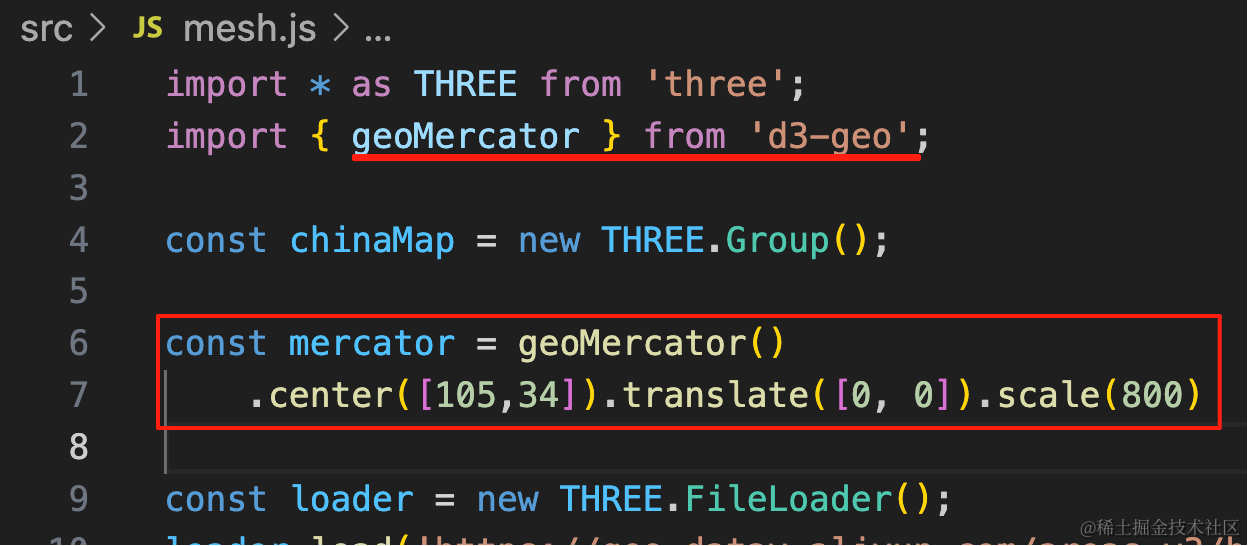
这个就是用 d3-geo 的 geoMercator 来做墨卡托转换。
后面的 center、translate、scale 方法后面讲。
然后我们解析 geojson 数据,根据是多边形,还是多个多边形来拿到轮廓数据:
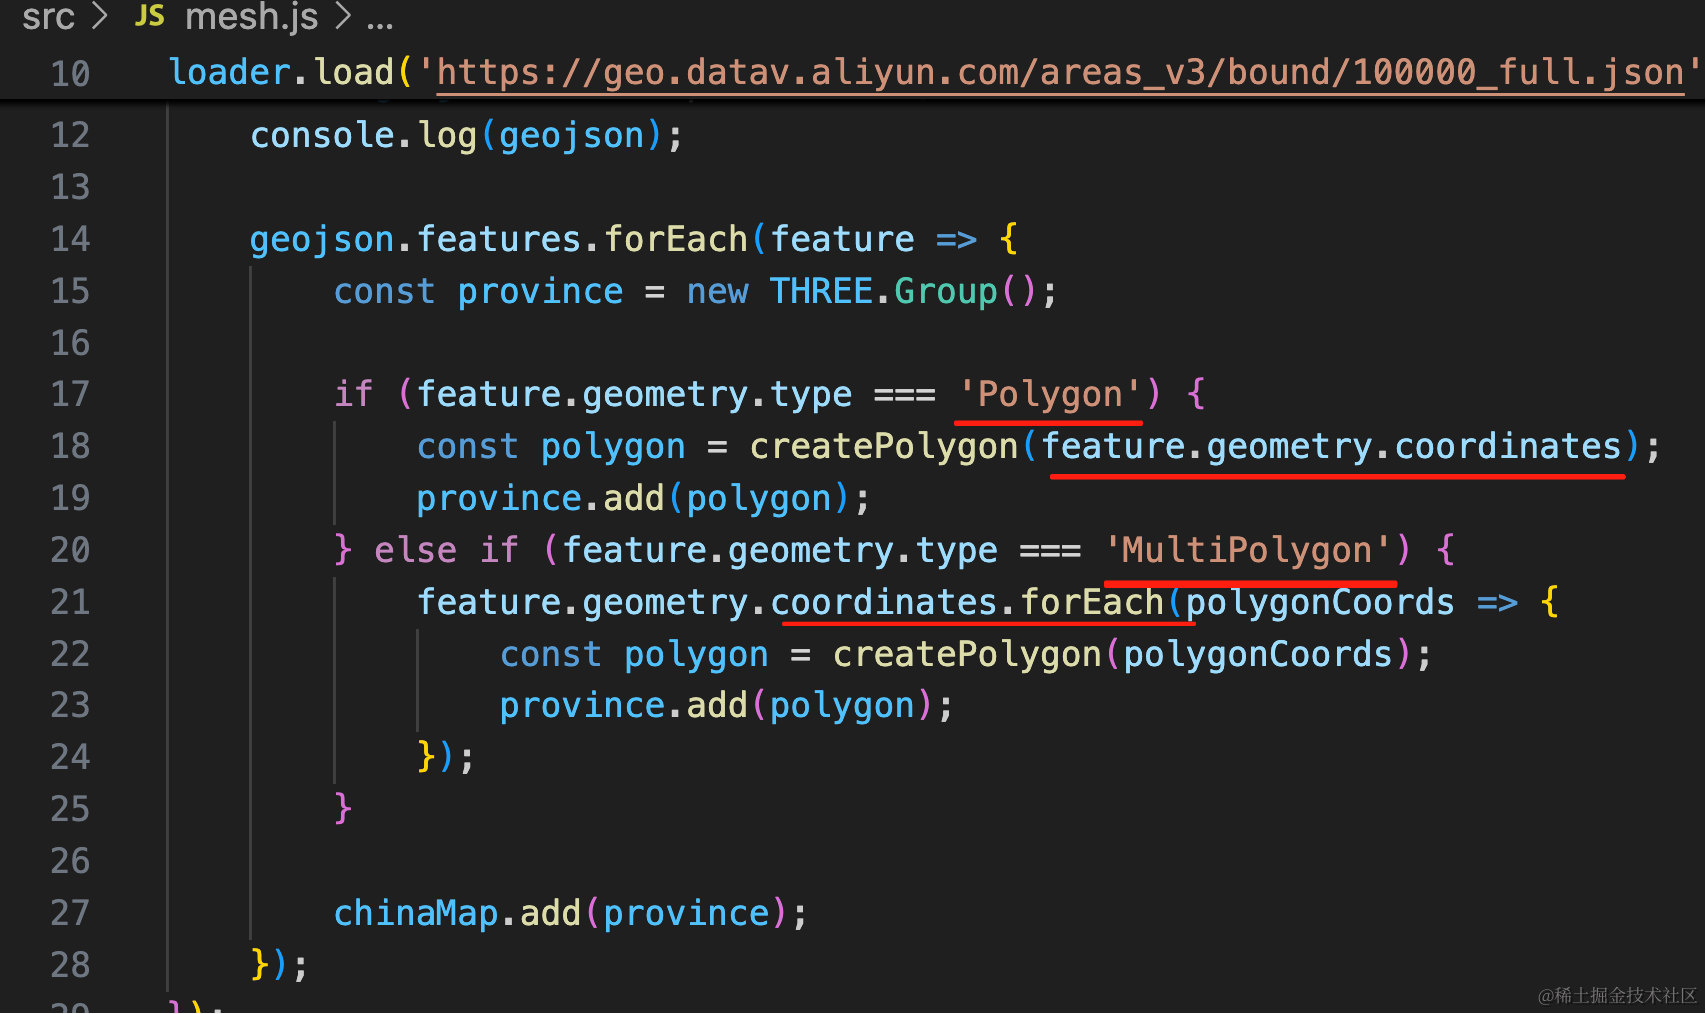
如果是单个多边形,那就直接拿到经纬度坐标数据。
如果是多个多边形,那再加个循环就好了。
然后拿到经纬度之后呢?
就是把经纬度转换为平面坐标,画图形:
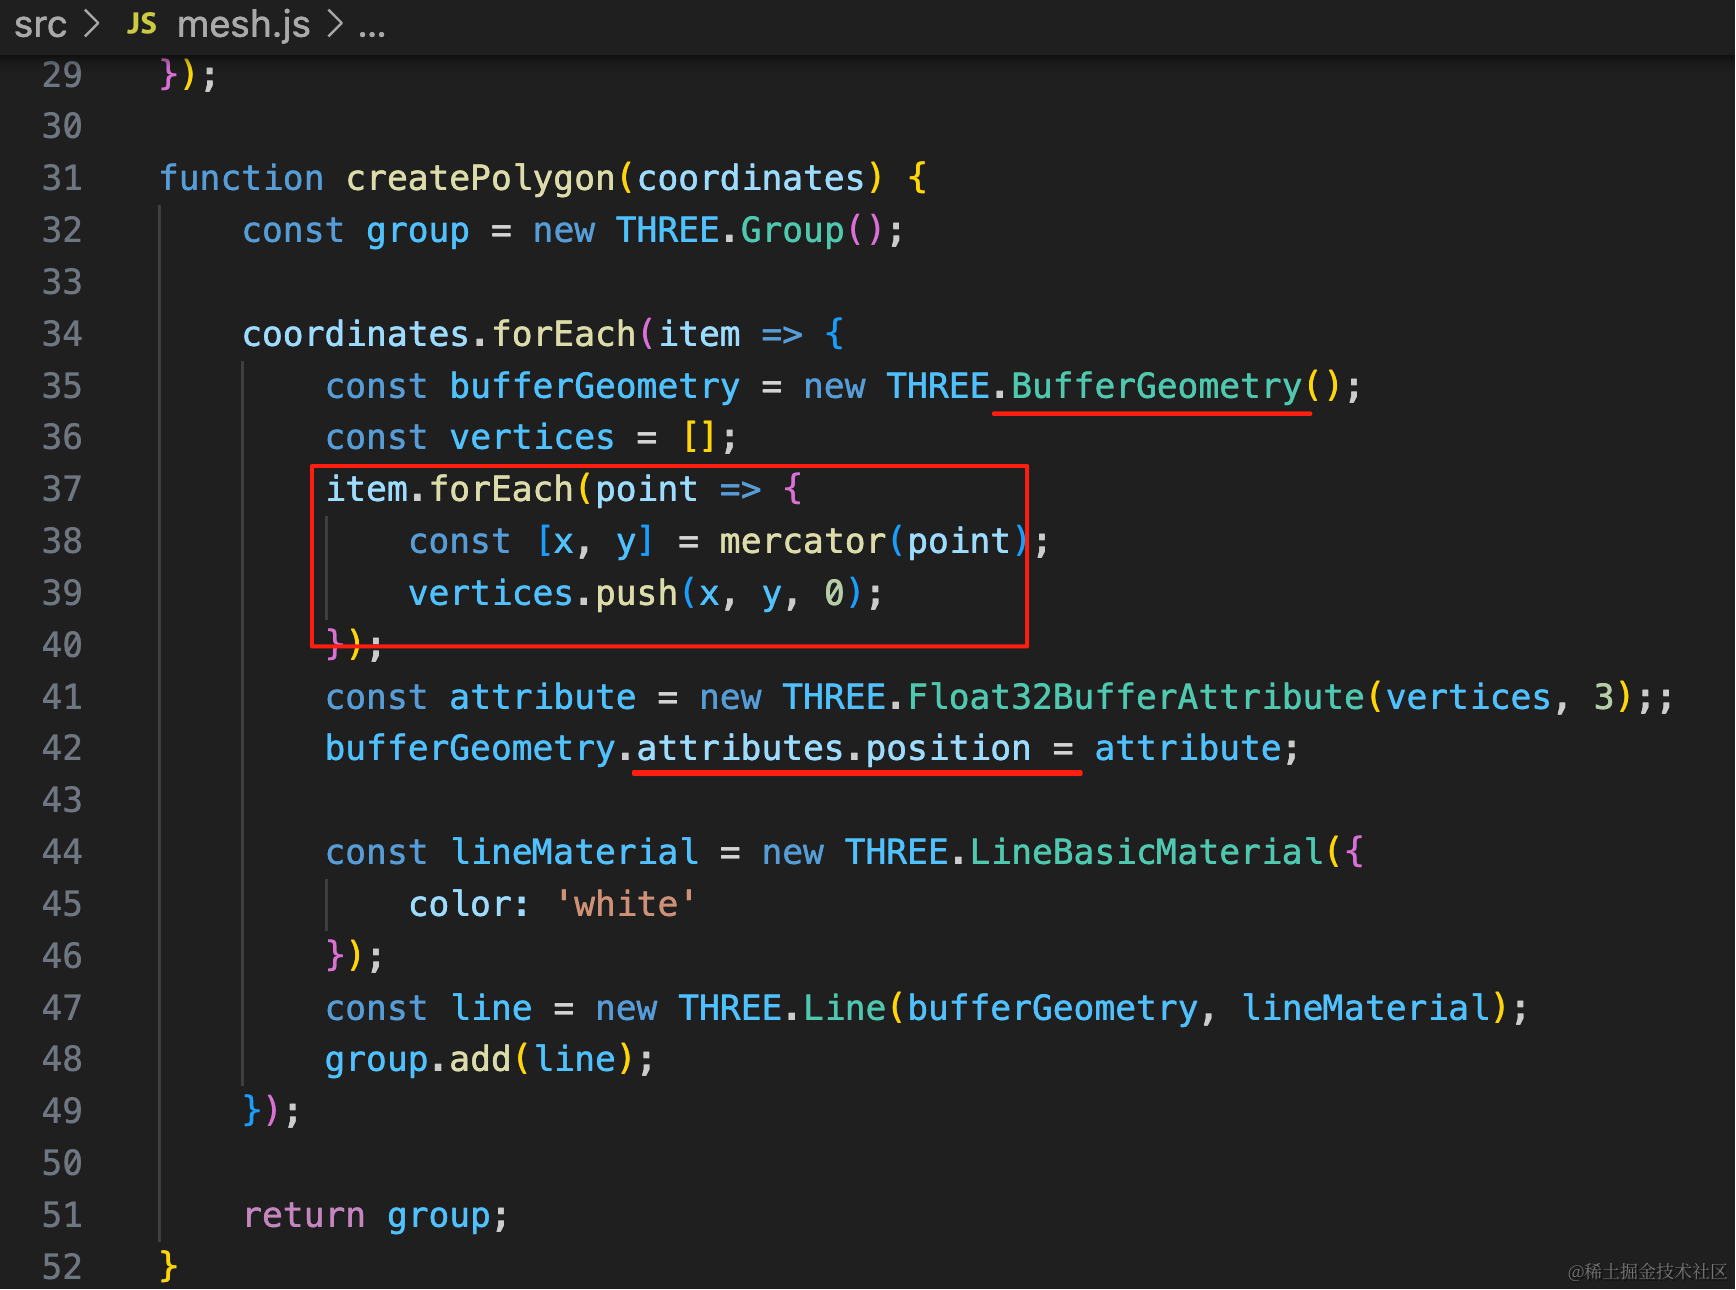
和前面一样,BufferGeometry + Line 来画线模型。
只不过这里的顶点是从经纬度通过扩卡托转换拿到的。
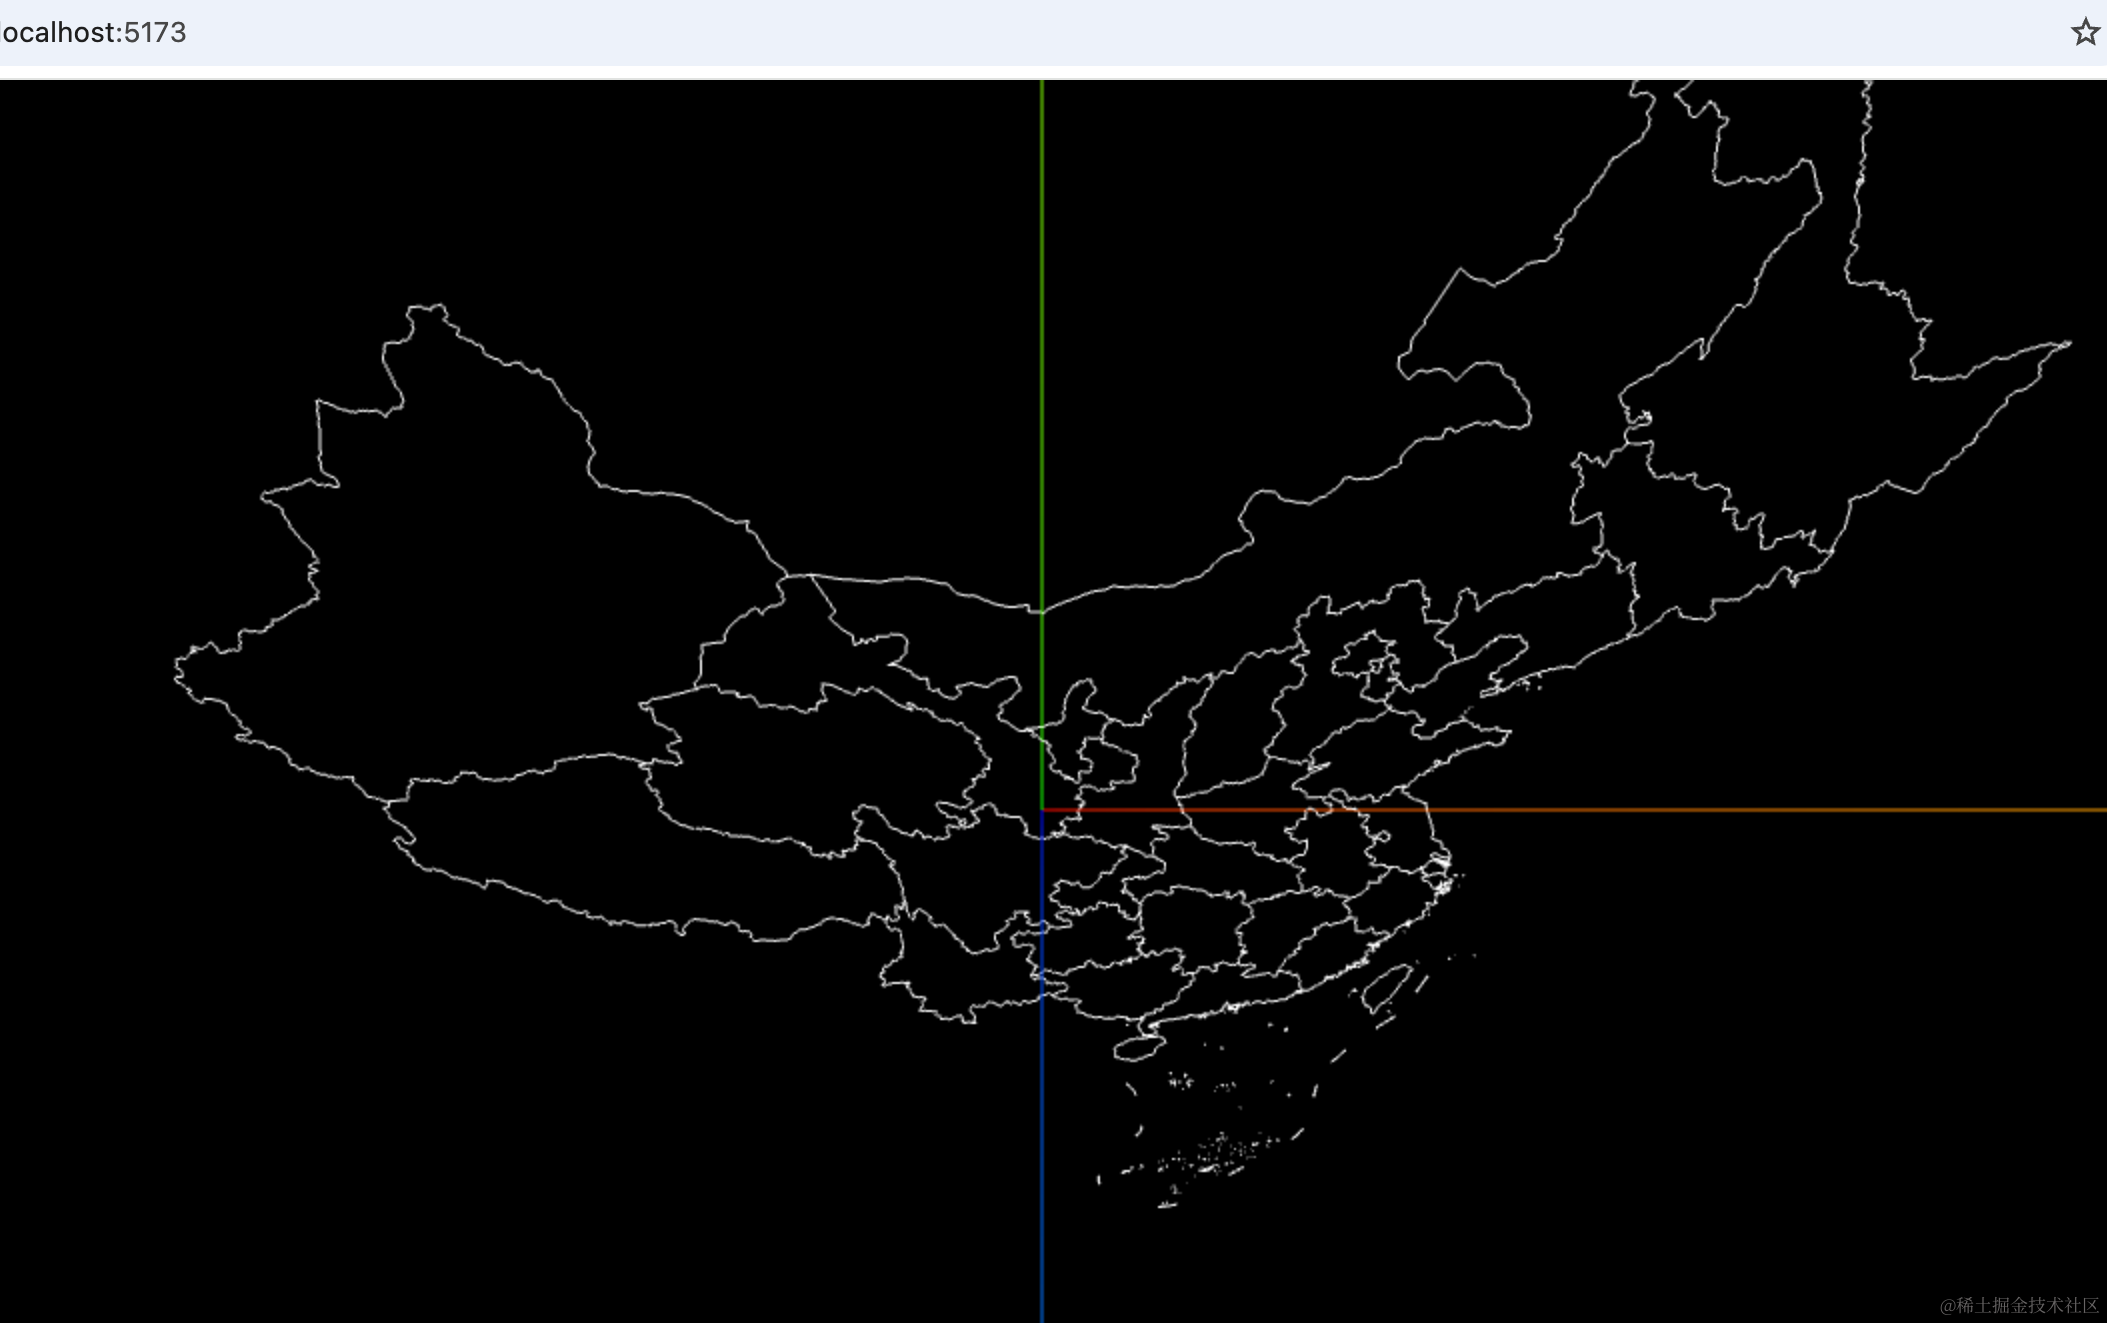
看下效果:
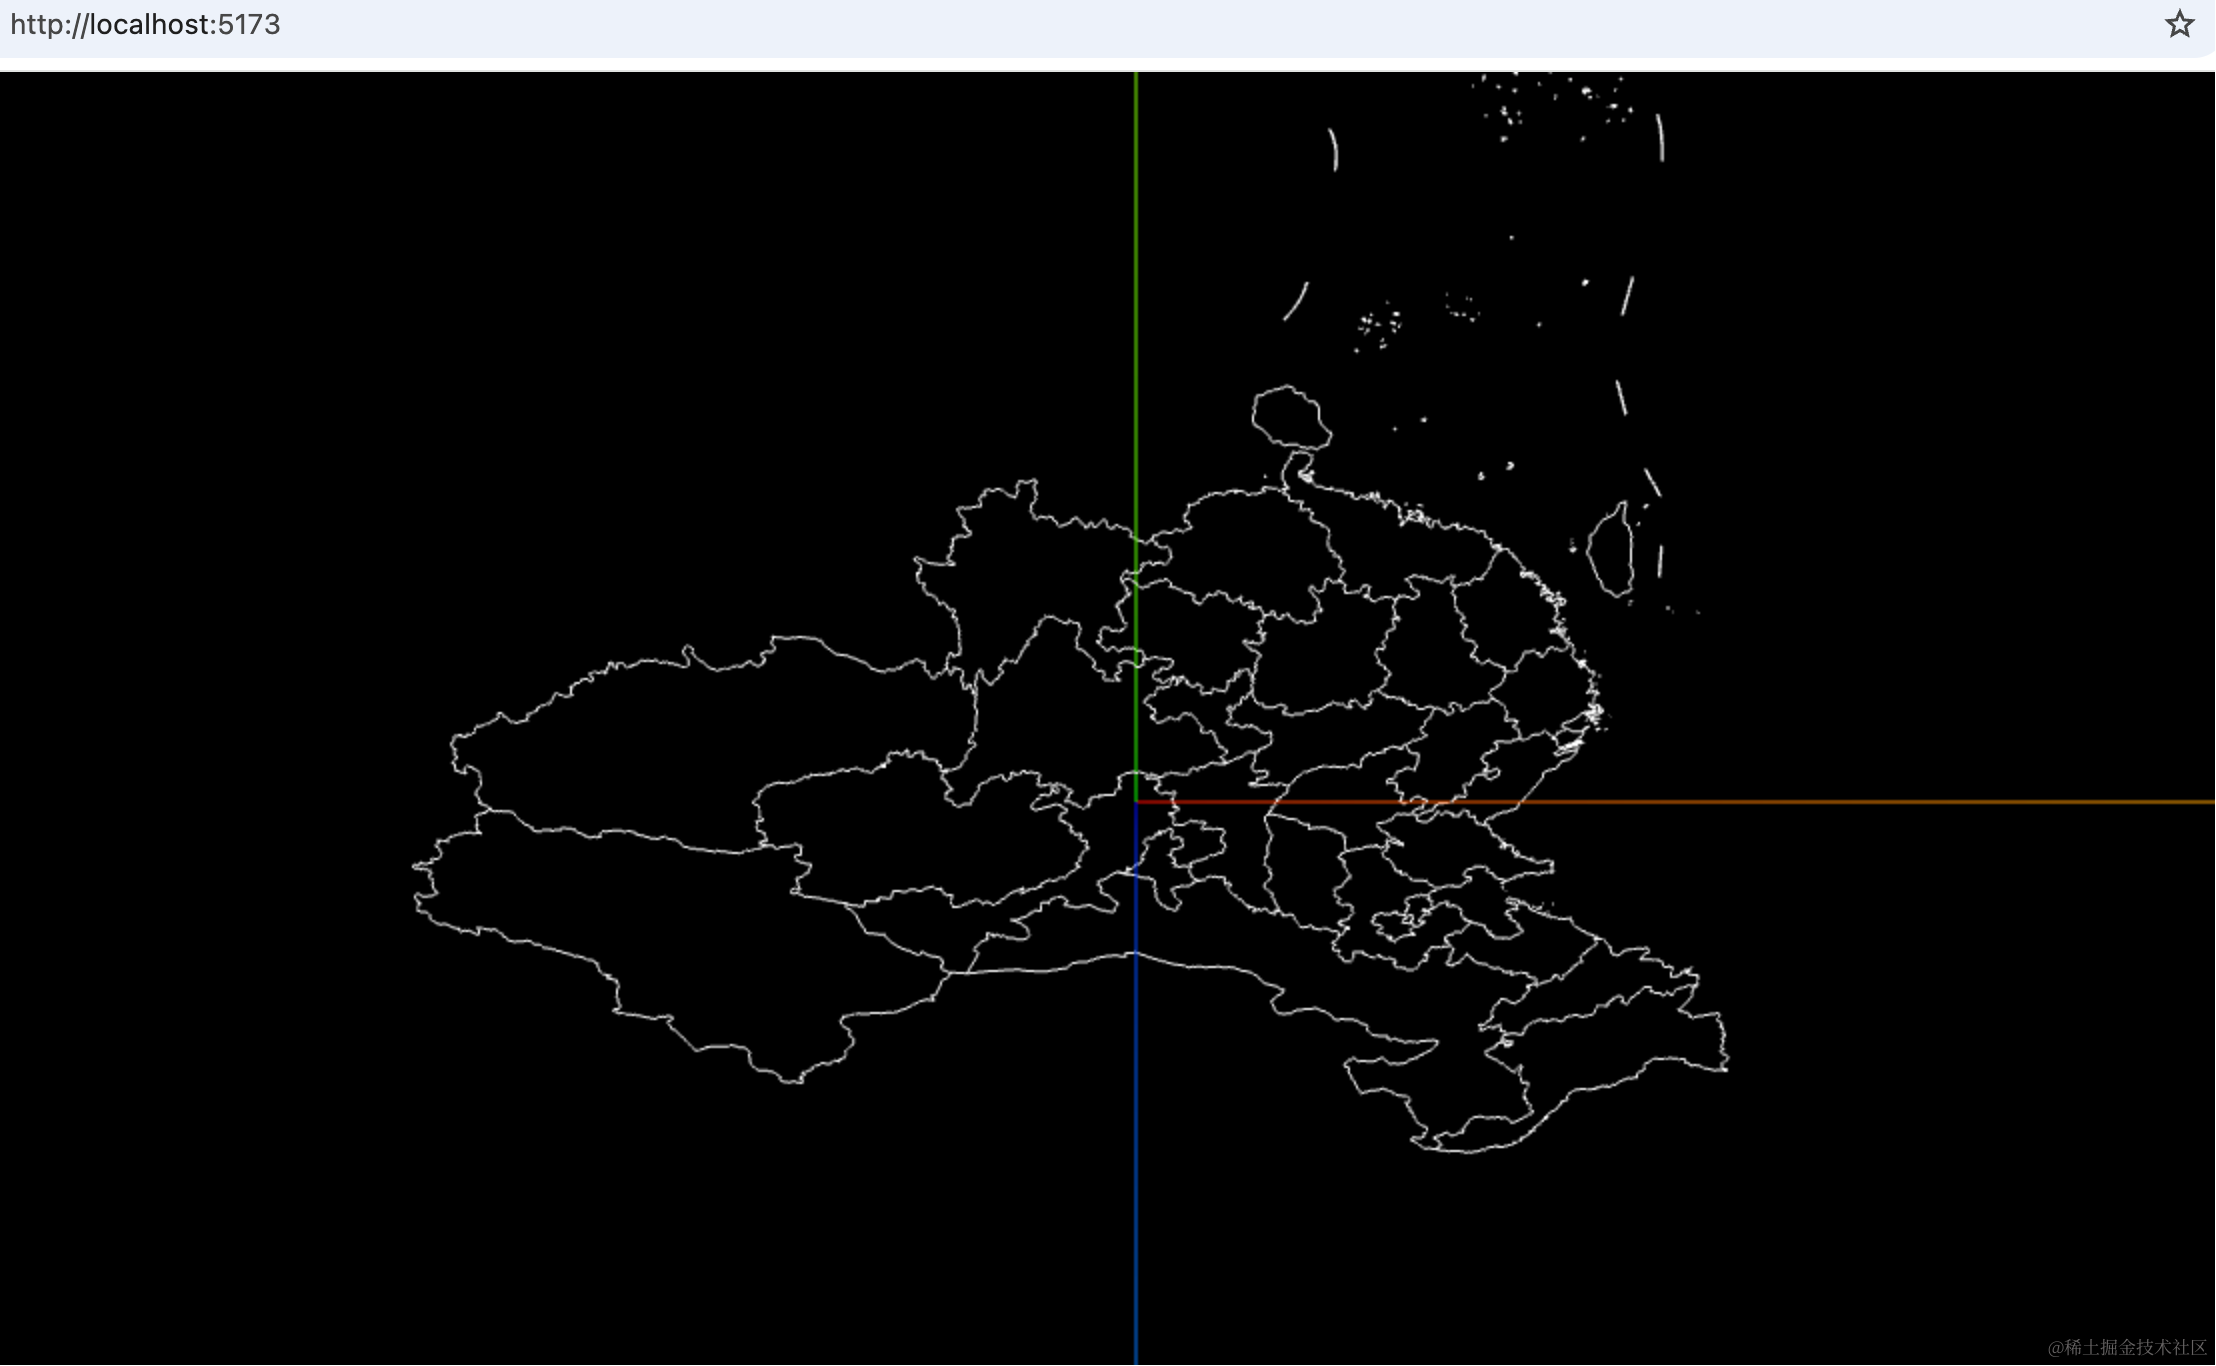
地图出来了,但是上下反了。
把 y 改成 -y 就好了:
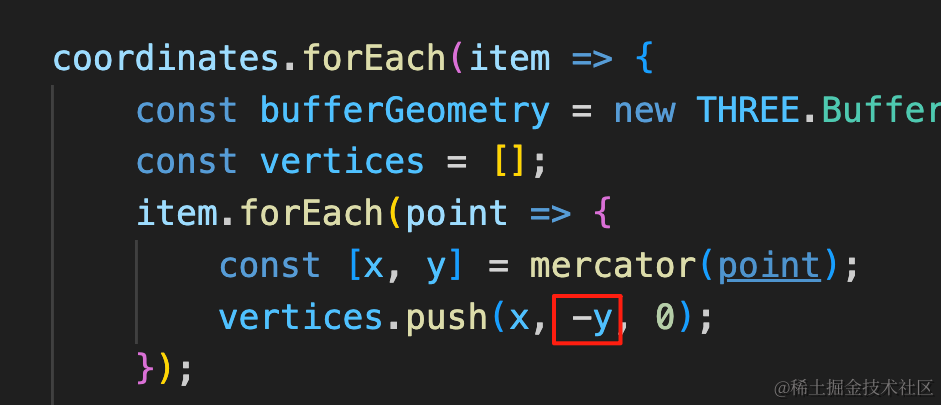
然后回过头来看这三个函数:
scale 很容易理解,改成 500 试试:
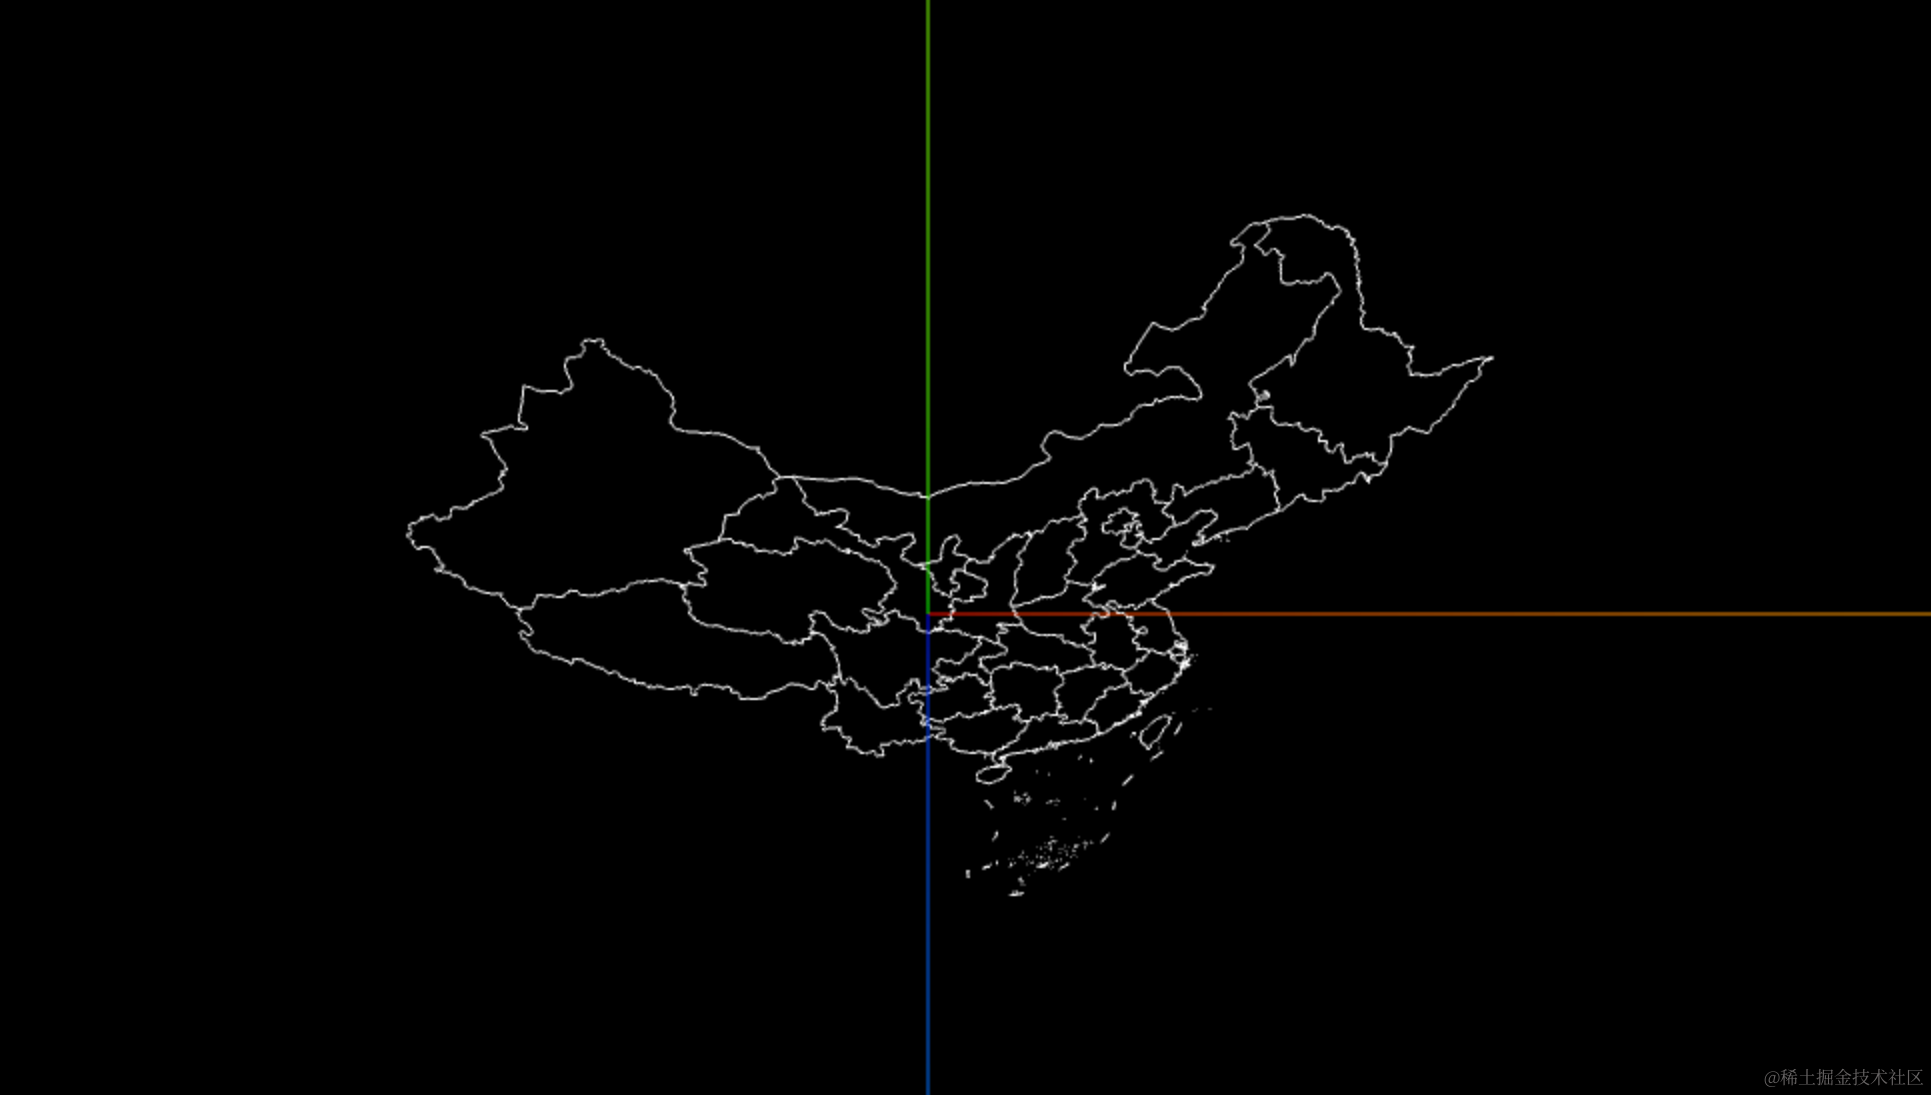
地图小了很多。
而 center 和 translate 是一起的,就是把这个经纬度放到坐标原点。
这个经纬度是怎么来的呢?
用百度地图这个坐标拾取器:
https://lbs.baidu.com/maptool/getpoint
鼠标选一个地点,复制经纬度,然后放到代码里就好了。
比如我们复制黑龙江省的坐标:
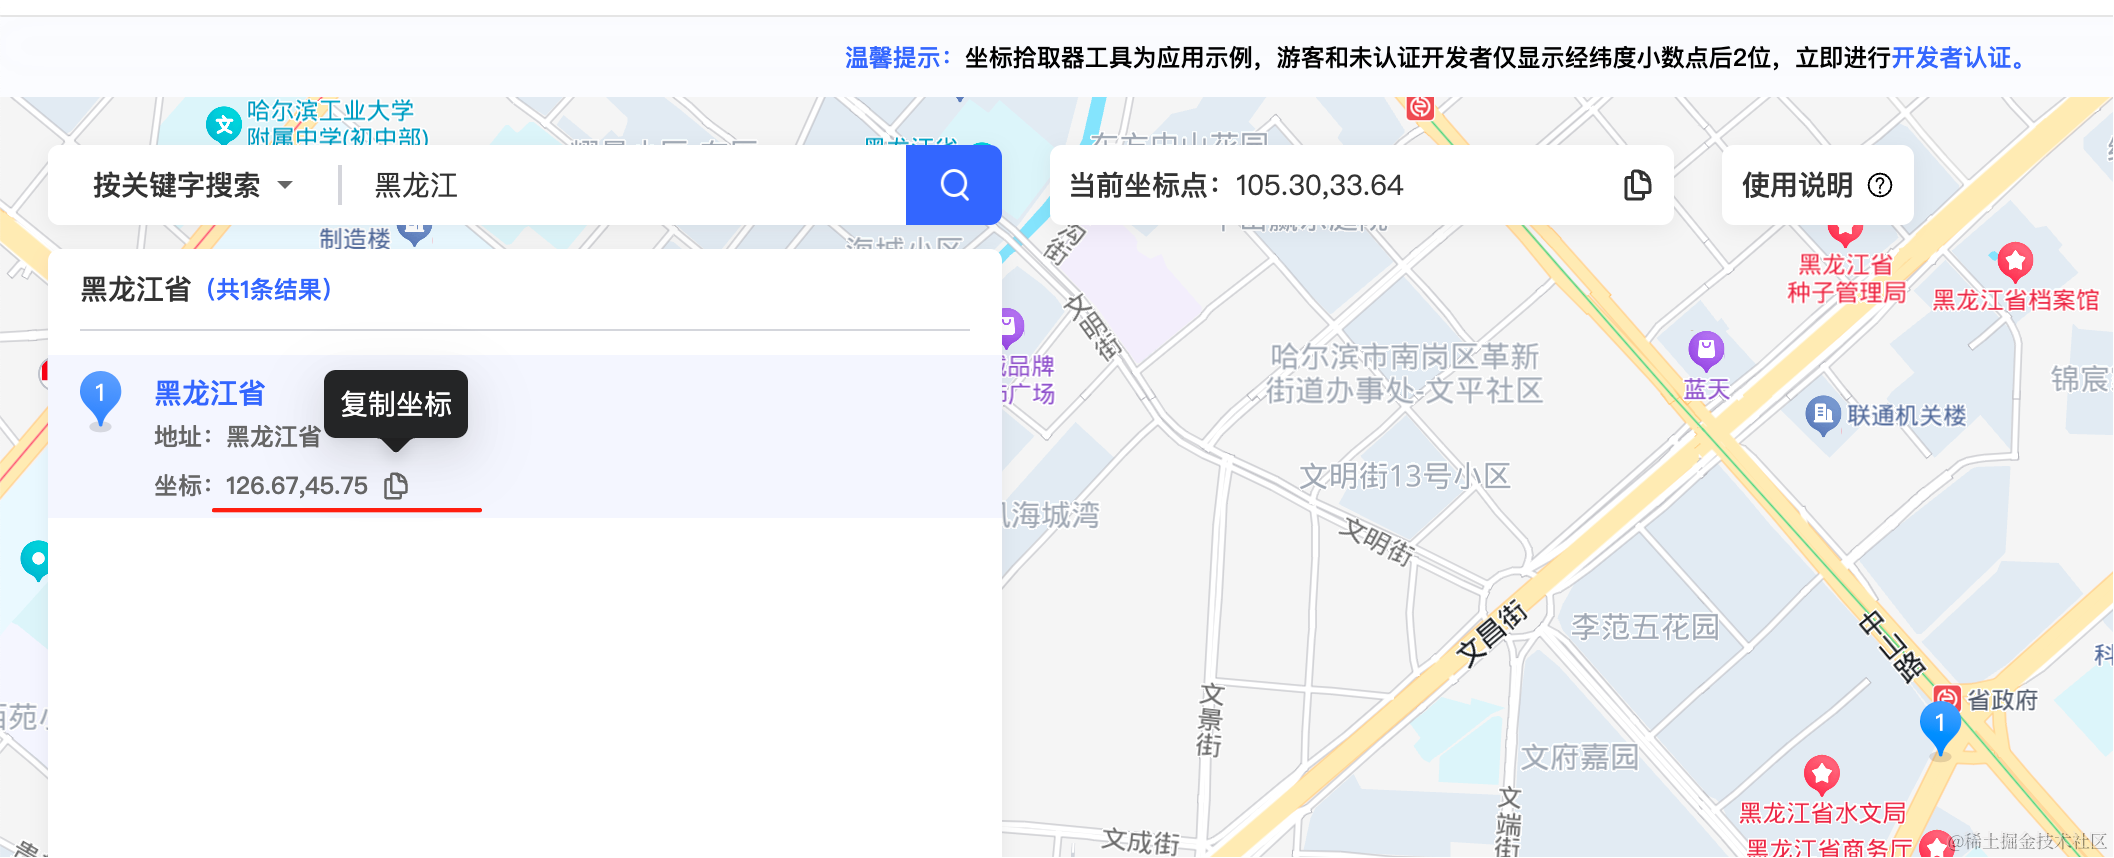
const mercator = geoMercator()
    .center([126.67,45.75]).translate([0, 0]).scale(500)
现在黑龙江省就移到坐标原点了:
这就是墨卡托转换的 center、translate、scale 函数的作用。
当然,前面说用 ShapeGeometry 来画,这里我们使用 BufferGeometry + Line 来画的,实际差不多,后面再用 Shape 画。
案例代码上传了小册仓库
总结
这节我们入门了下 geojson。
geojson 里有城市、国家的轮廓数据,解析其中的多边形用 Line 或者 Shape 画出来。
这里要用墨卡托转换,这个是用来把经纬度转为平面坐标的。
这两个难点:
- geojson 里的轮廓数据解析,画出形状
- d3-geo 的 geoMercator 做墨卡托转换,经纬度转平面坐标
理解了这两点,就能轻松画出各种地图了。