很多时候我们需要在地图上加一些标注:
比如加一些不同高度的柱:
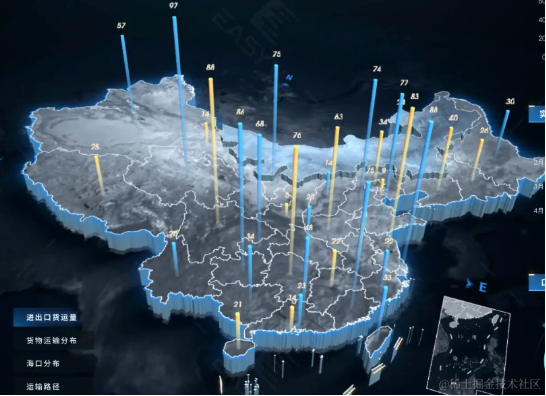
如何实现这种标注呢?
也是用墨卡托转换,拿到标注点的经纬度,比如省会城市的,然后转为平面坐标,在那个位置绘制一个标注就好了。
我们来试一下:
npx create-vite map-annotation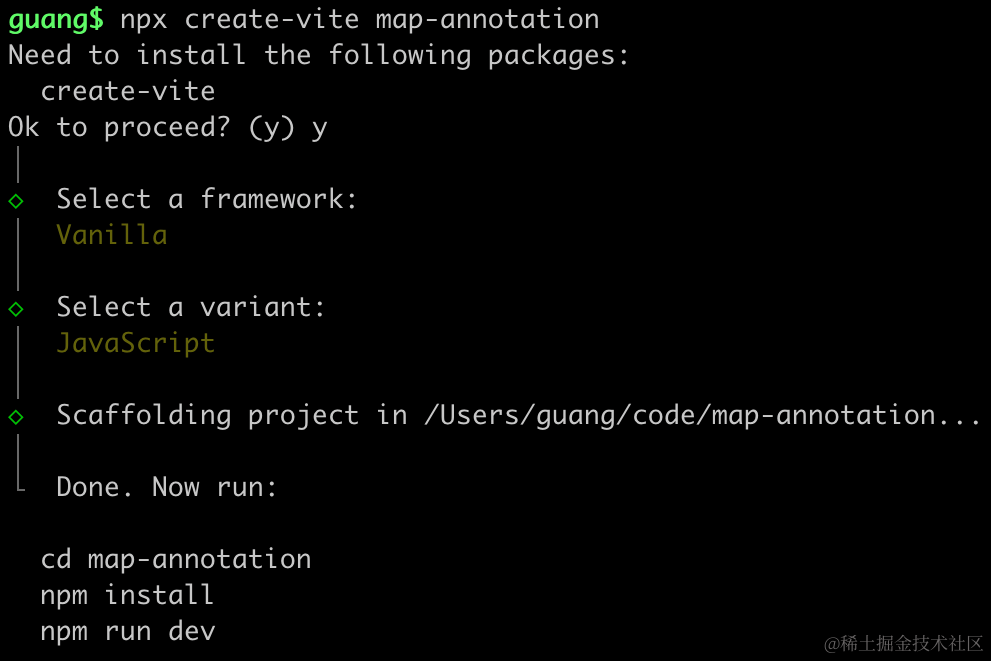
创建项目,进入项目,安装依赖:
pnpm install
pnpm install --save three
pnpm install --save-dev @types/three
改下 src/main.js
import './style.css';
import * as THREE from 'three';
import {
    OrbitControls
} from 'three/addons/controls/OrbitControls.js';
import mesh from './mesh.js';

const scene = new THREE.Scene();

scene.add(mesh);

const light = new THREE.DirectionalLight(0xffffff);
light.position.set(500, 300, 600);
scene.add(light);

const light2 = new THREE.AmbientLight();
scene.add(light2);

const axesHelper = new THREE.AxesHelper(1000);
scene.add(axesHelper);

const width = window.innerWidth;
const height = window.innerHeight;

const camera = new THREE.PerspectiveCamera(60, width / height, 1, 10000);
camera.position.set(0, 200, 600);
camera.lookAt(0, 0, 0);

const renderer = new THREE.WebGLRenderer({
  antialias: true
});
renderer.setSize(width, height)

function render() {
    renderer.render(scene, camera);
    requestAnimationFrame(render);
}

render();

document.body.append(renderer.domElement);

const controls = new OrbitControls(camera, renderer.domElement);
创建 Scene、Light、Camera、Renderer
改下 style.css
body {
    margin: 0;
}
然后创建 mesh.js
import * as THREE from 'three';
import { geoMercator } from 'd3-geo';

const chinaMap = new THREE.Group();

const mercator = geoMercator()
    .center([105,34]).translate([0, 0]).scale(600)

const loader = new THREE.FileLoader();
loader.load('https://geo.datav.aliyun.com/areas_v3/bound/100000_full.json', function (data) {
    const geojson = JSON.parse(data);
    console.log(geojson);

    geojson.features.forEach(feature => {
        const province = new THREE.Group();

        if (feature.geometry.type === 'Polygon') {
            const polygon = createPolygon(feature.geometry.coordinates);
            province.add(polygon);
        } else if (feature.geometry.type === 'MultiPolygon') {
            feature.geometry.coordinates.forEach(polygonCoords => {
                const polygon = createPolygon(polygonCoords);
                province.add(polygon);
            });
        }

        chinaMap.add(province);
    });
});

function createPolygon(coordinates) {
    const group = new THREE.Group();

    coordinates.forEach(item => {
        const bufferGeometry = new THREE.BufferGeometry();
        const vertices = [];
        item.forEach(point => {
            const [x, y] = mercator(point);
            vertices.push(x, -y, 0);
        });
        const attribute = new THREE.Float32BufferAttribute(vertices, 3);;
        bufferGeometry.attributes.position = attribute;

        const lineMaterial = new THREE.LineBasicMaterial({
            color: 'white'
        });
        const line = new THREE.Line(bufferGeometry, lineMaterial);
        group.add(line);
    });

    return group;
}

export default chinaMap;
这里和上节一样,用 Line + BufferGeometry 把中国地图轮廓画出来。
安装下 d3-geo
pnpm install --save d3-geo
pnpm install --save-dev @types/d3-geo
跑一下:
npm run dev
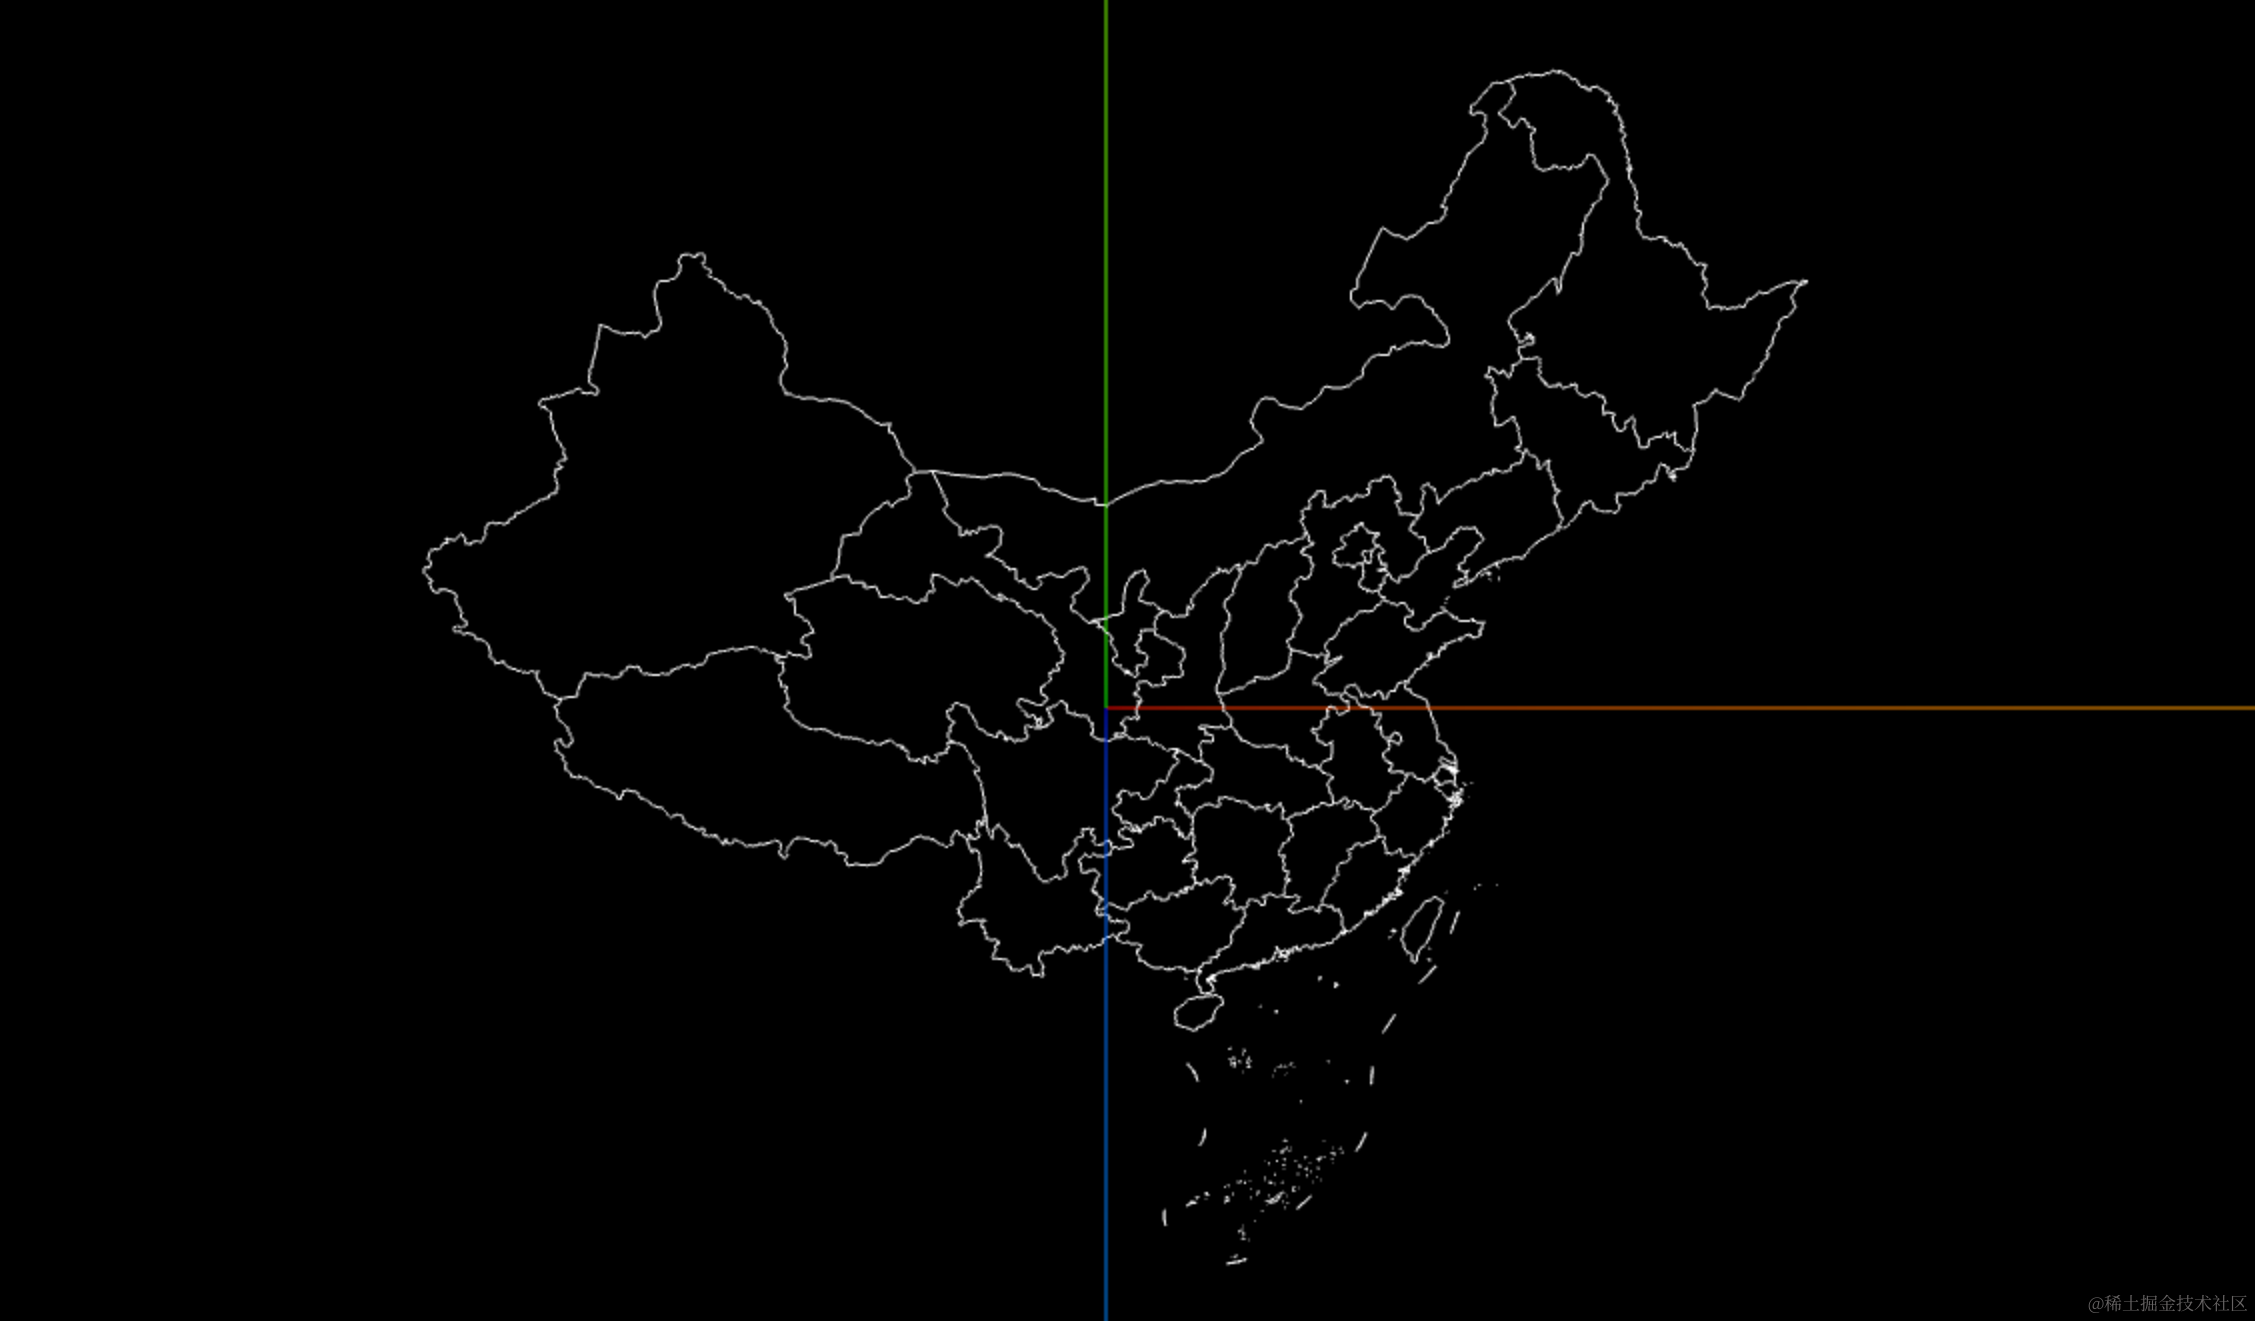
和上节一样,调了下 scale 和相机位置。
看下 geojson:
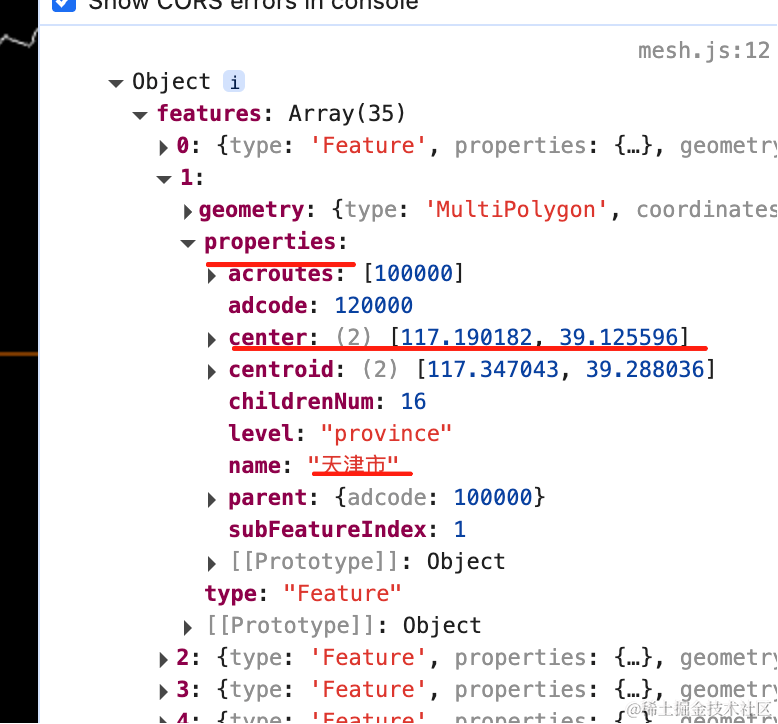
feature 的 properties 里有没个城市的 center 的经纬度。
那我们在这个位置加一个矩形试试:
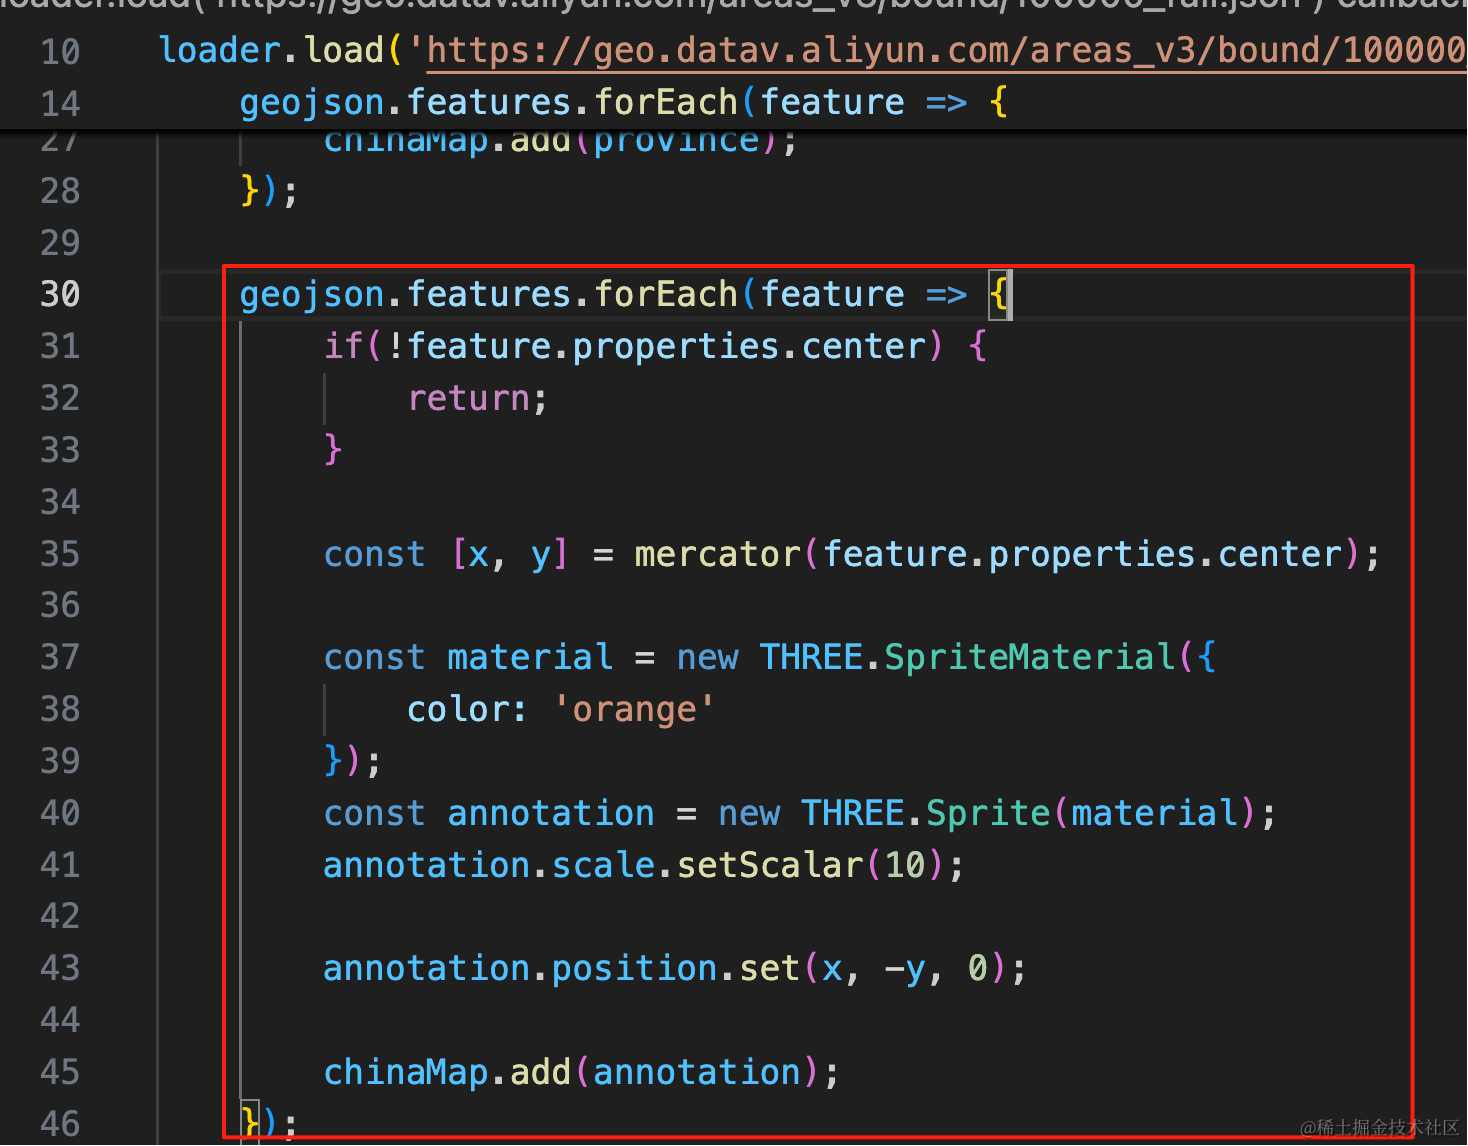
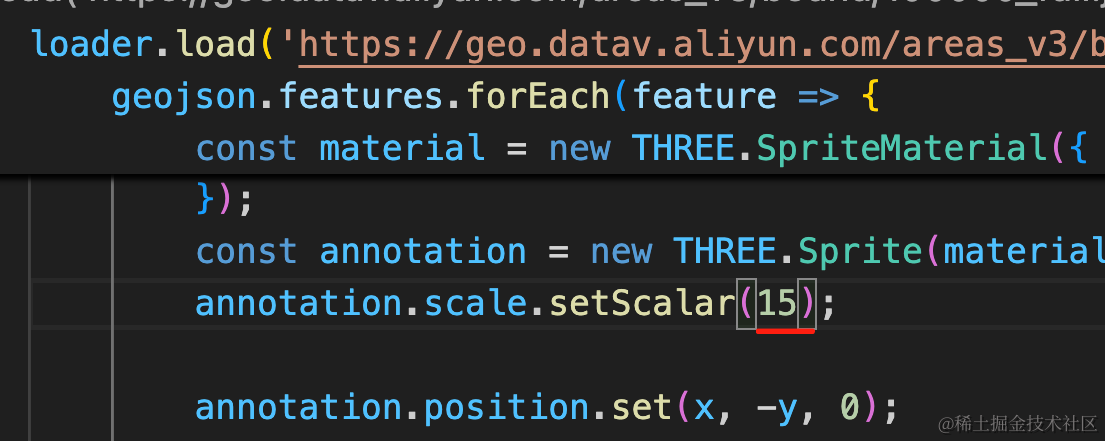
还是遍历 features,这次是取 properties.center
用墨卡托转换把它变为 x、y 坐标。
在那个位置创建一个 10 * 10 的矩形小方块。
因为之前地图反了,这里也要设置 x、-y、0
geojson.features.forEach(feature => {
if(!feature.properties.center) {
return;
}
const [x, y] = mercator(feature.properties.center);
const material = new THREE.SpriteMaterial({
color: 'orange'
});
const annotation = new THREE.Sprite(material);
annotation.scale.setScalar(10);
annotation.position.set(x, -y, 0);
chinaMap.add(annotation);
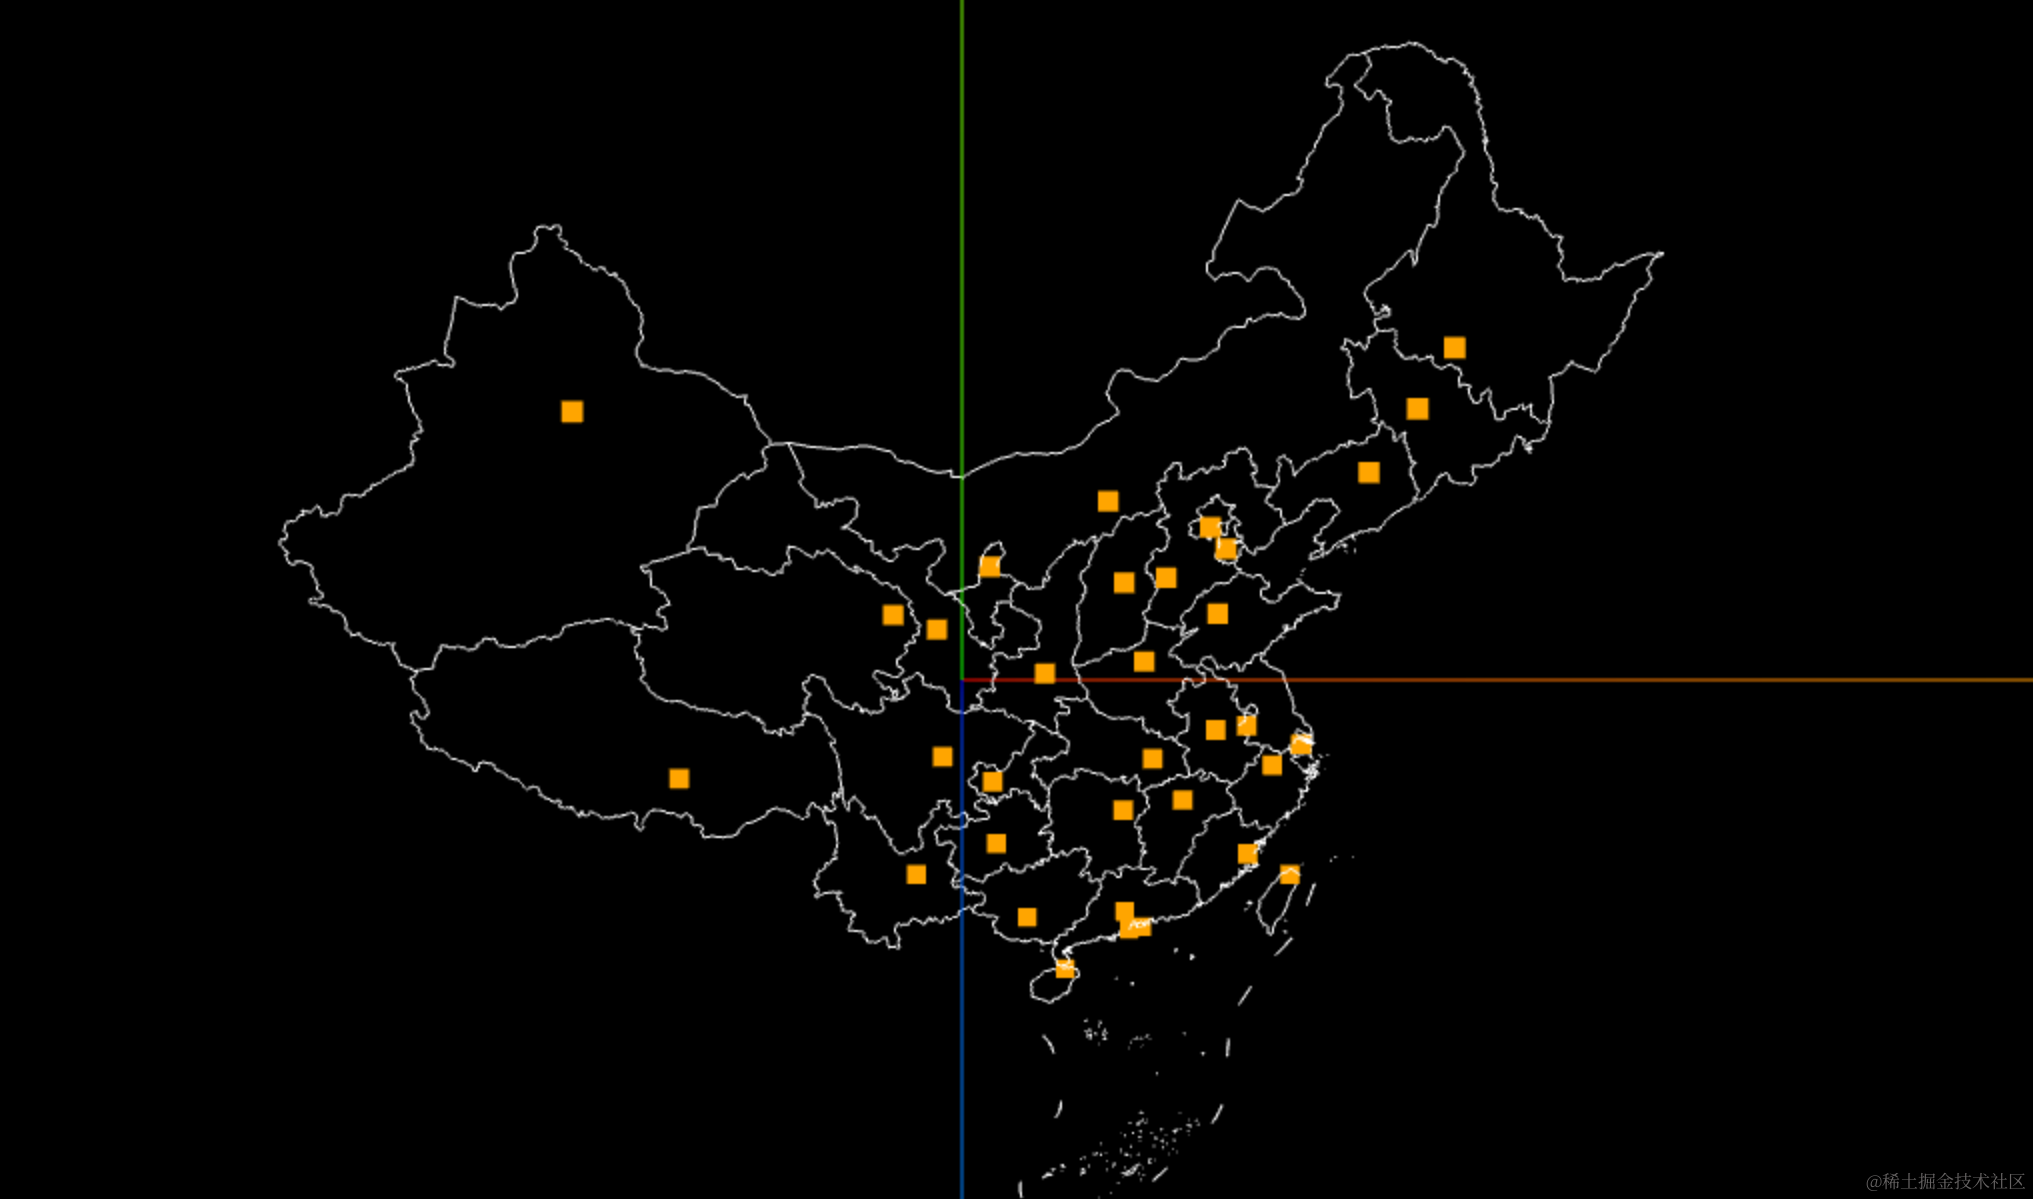
});看下效果:
还是直接标注出城市名字比较好。
我们用 three-spritetext 来画
pnpm install --save three-spritetext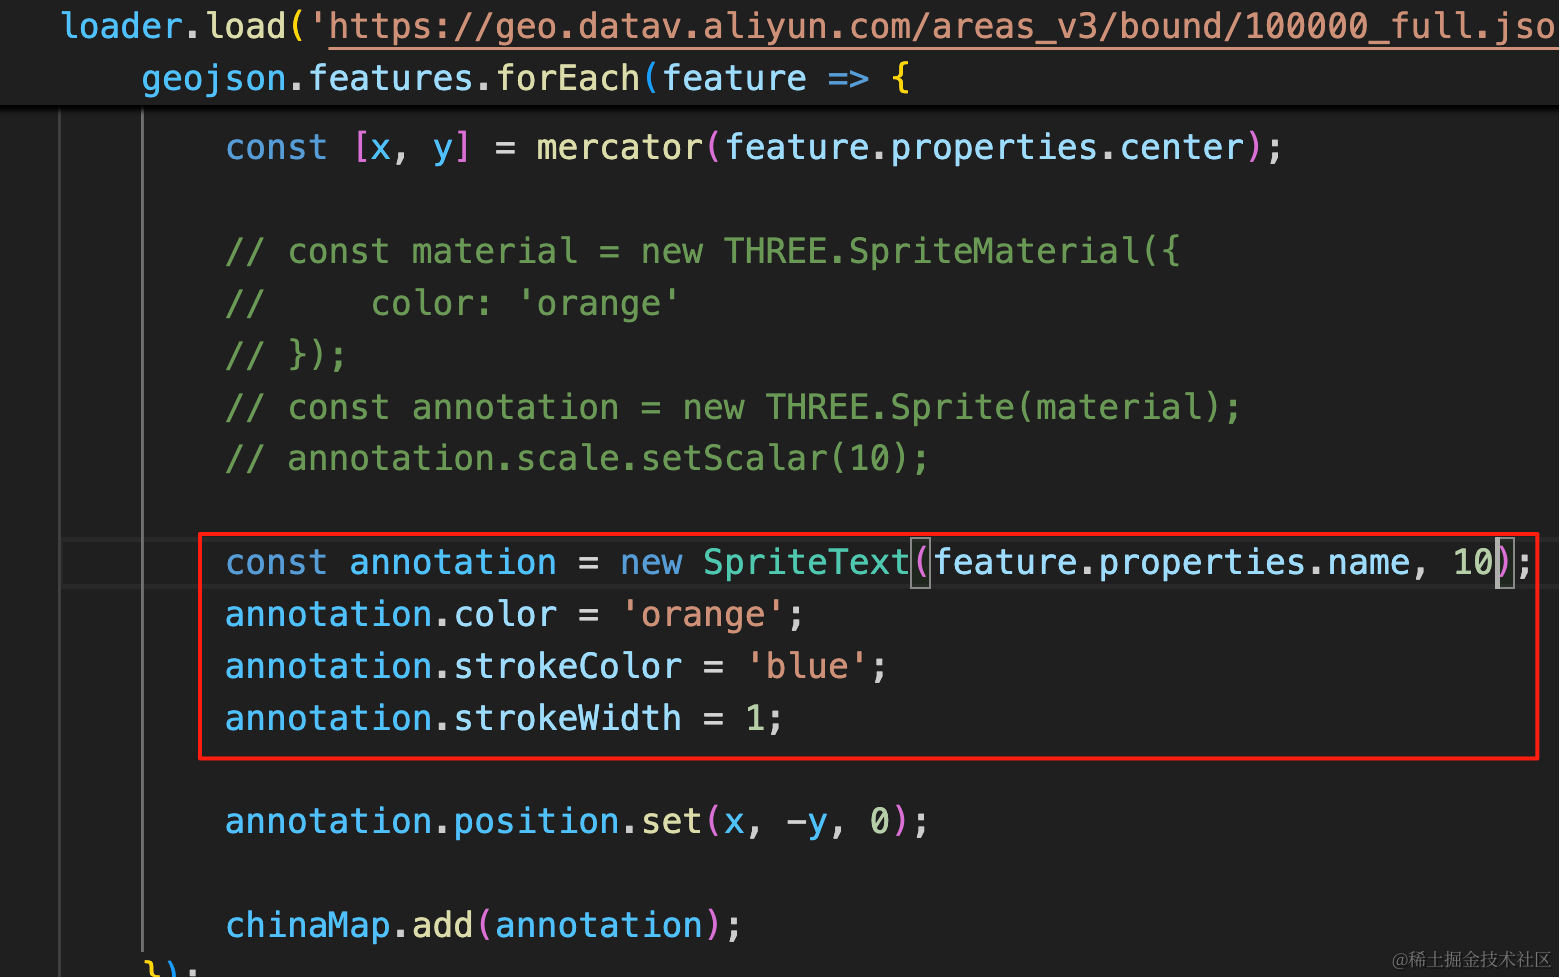
const annotation = new SpriteText(feature.properties.name, 10);
annotation.color = 'orange';
annotation.strokeColor = 'blue';
annotation.strokeWidth = 1;
换成 SpriteText 的文字标注
看下效果:
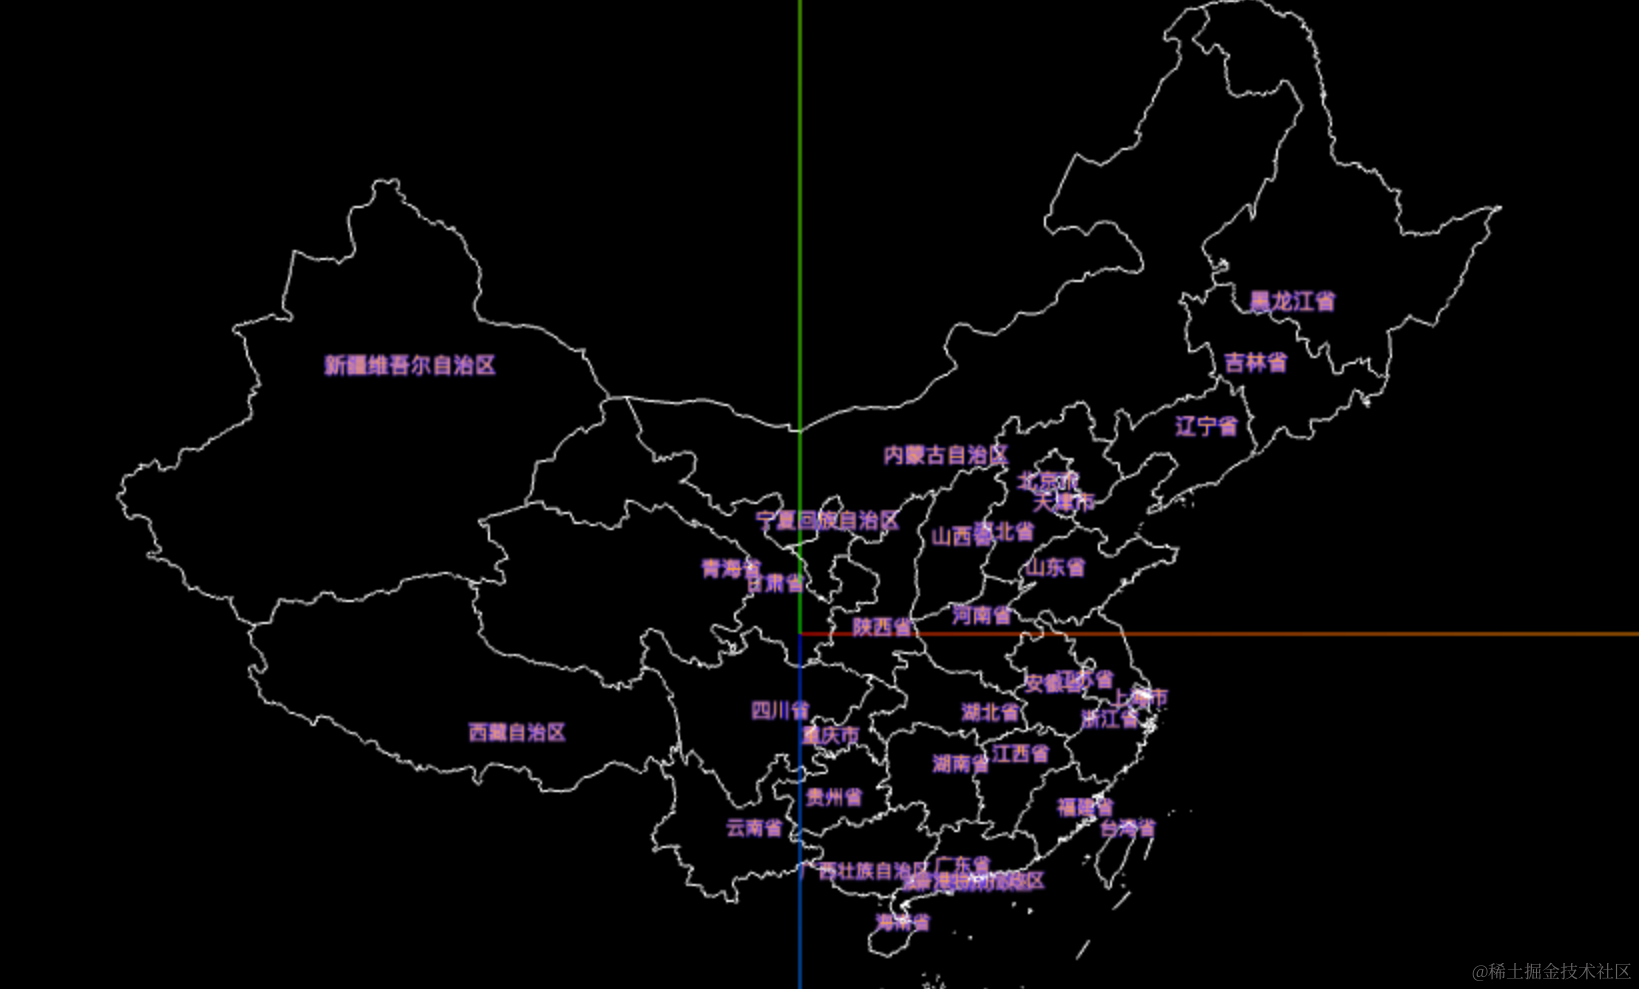
这样,省的名字就标注出来了。
不过这样太拥挤,最好是刚开始用点标注,mouseover 的时候再展示名字。
找张图片,用百度的智能抠图抠一下:
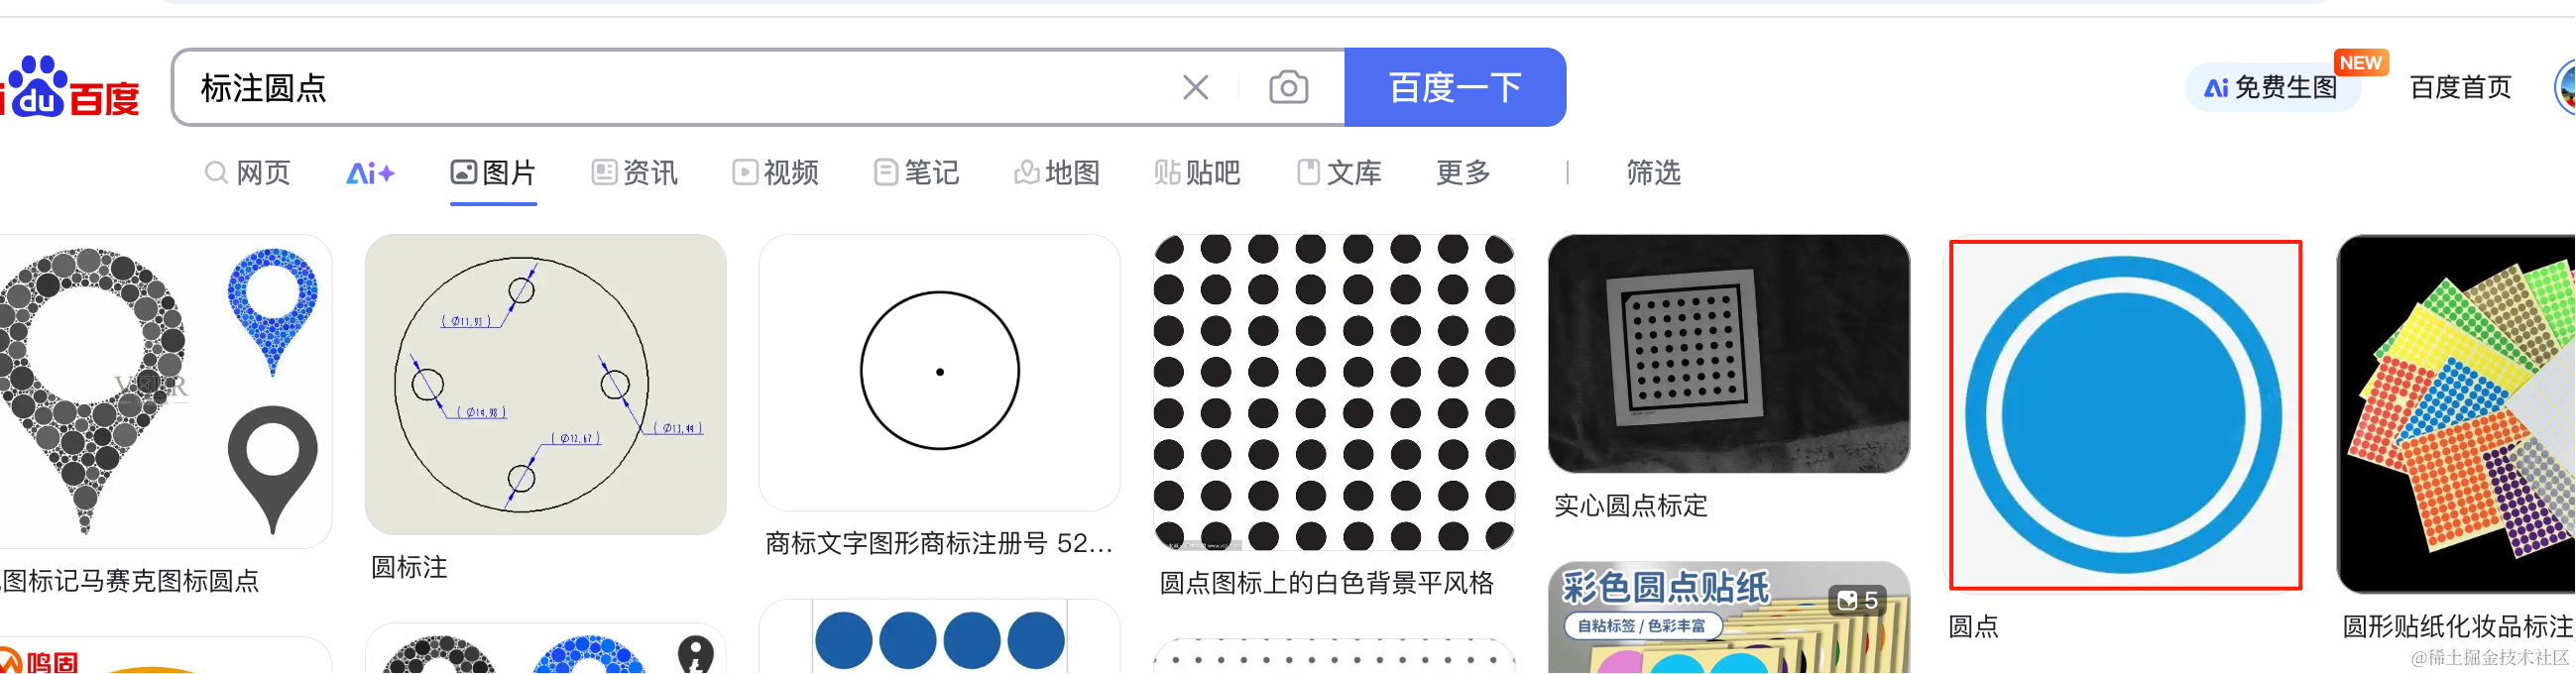
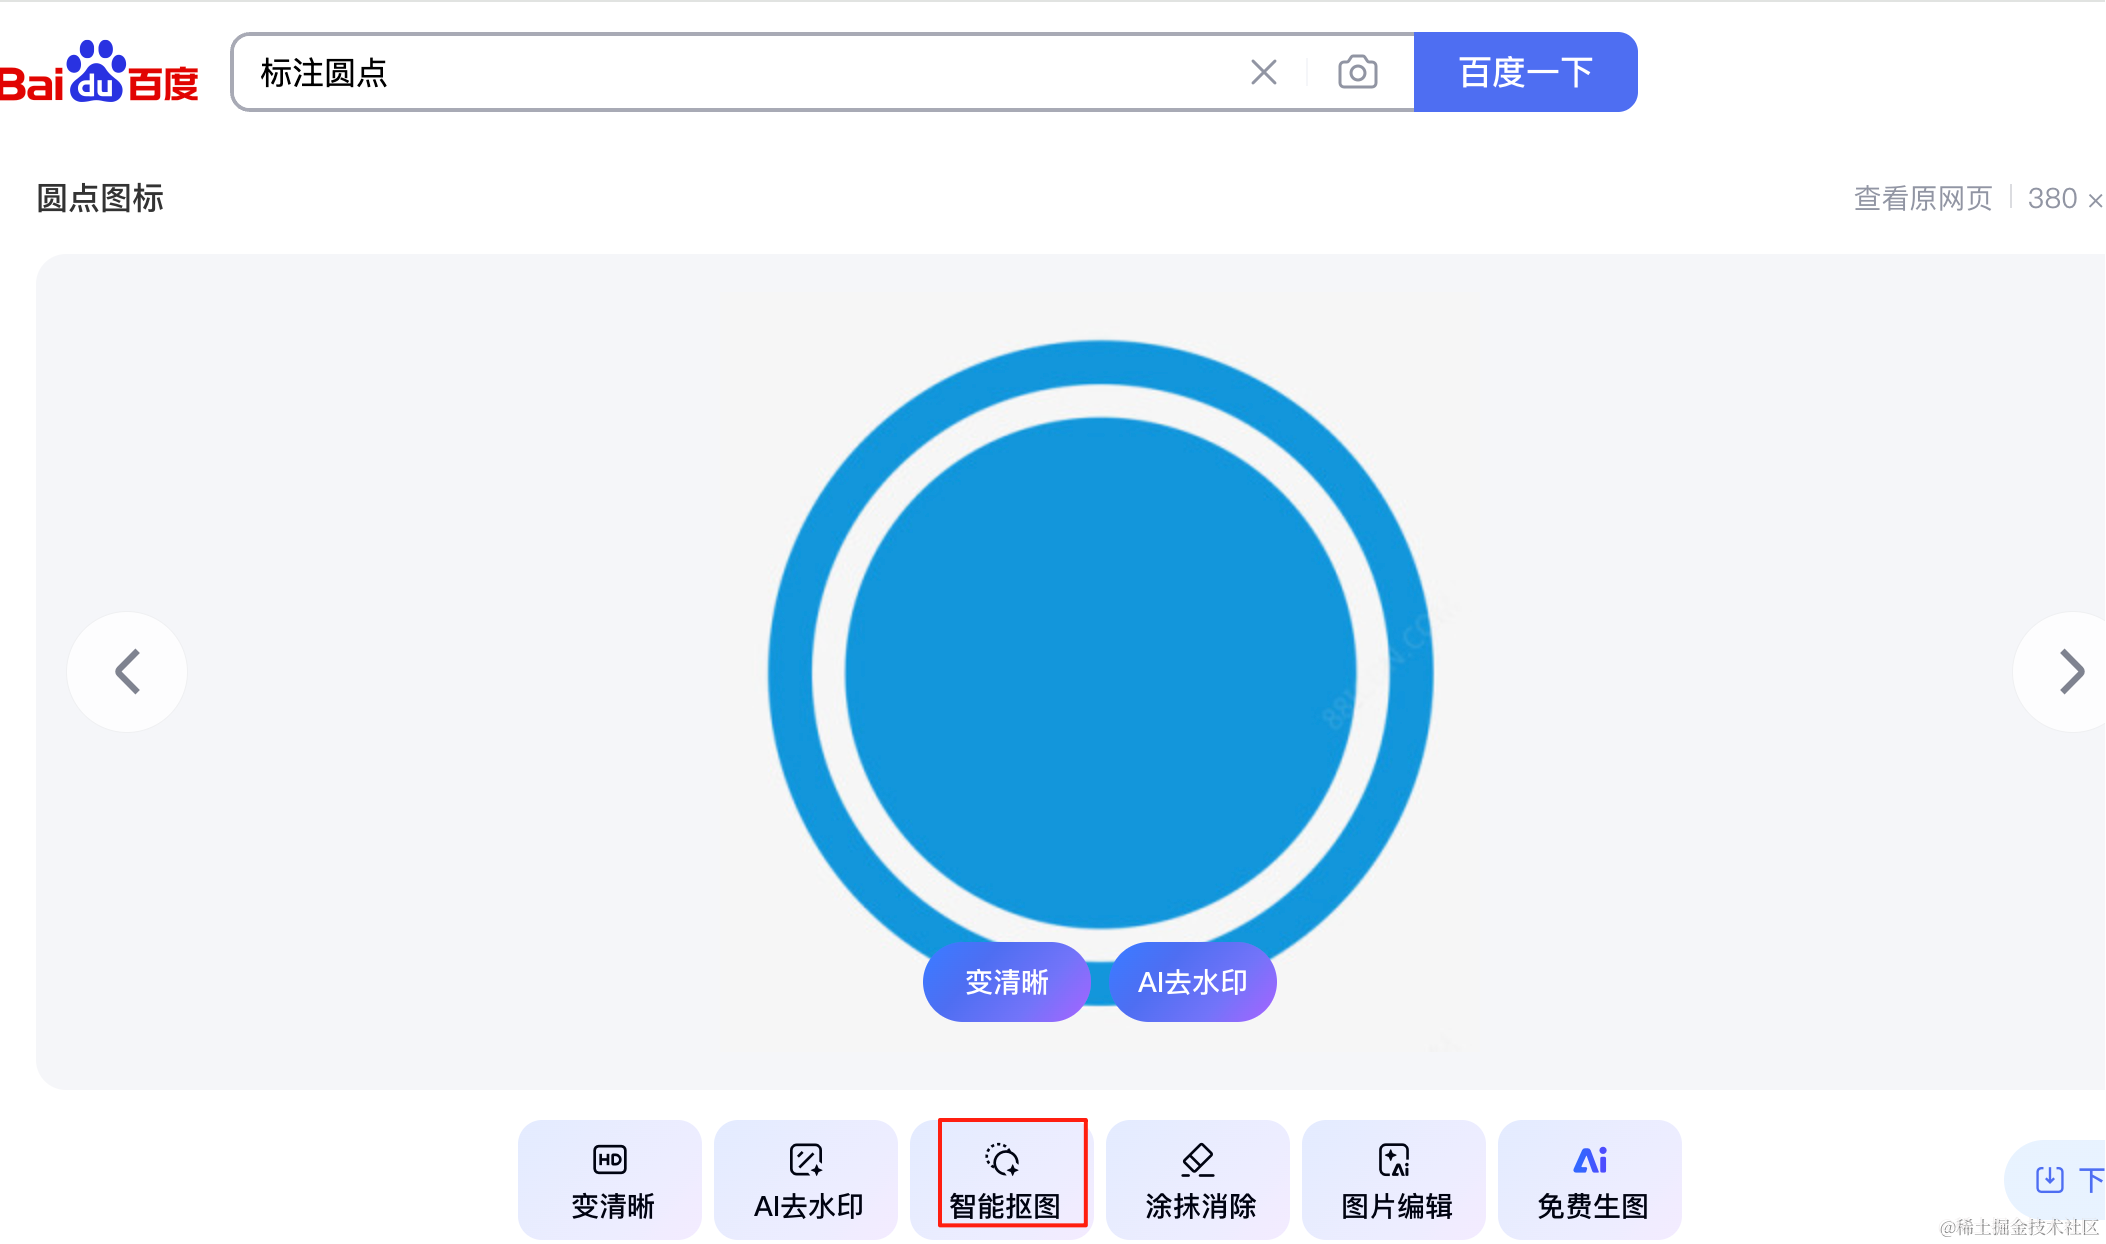
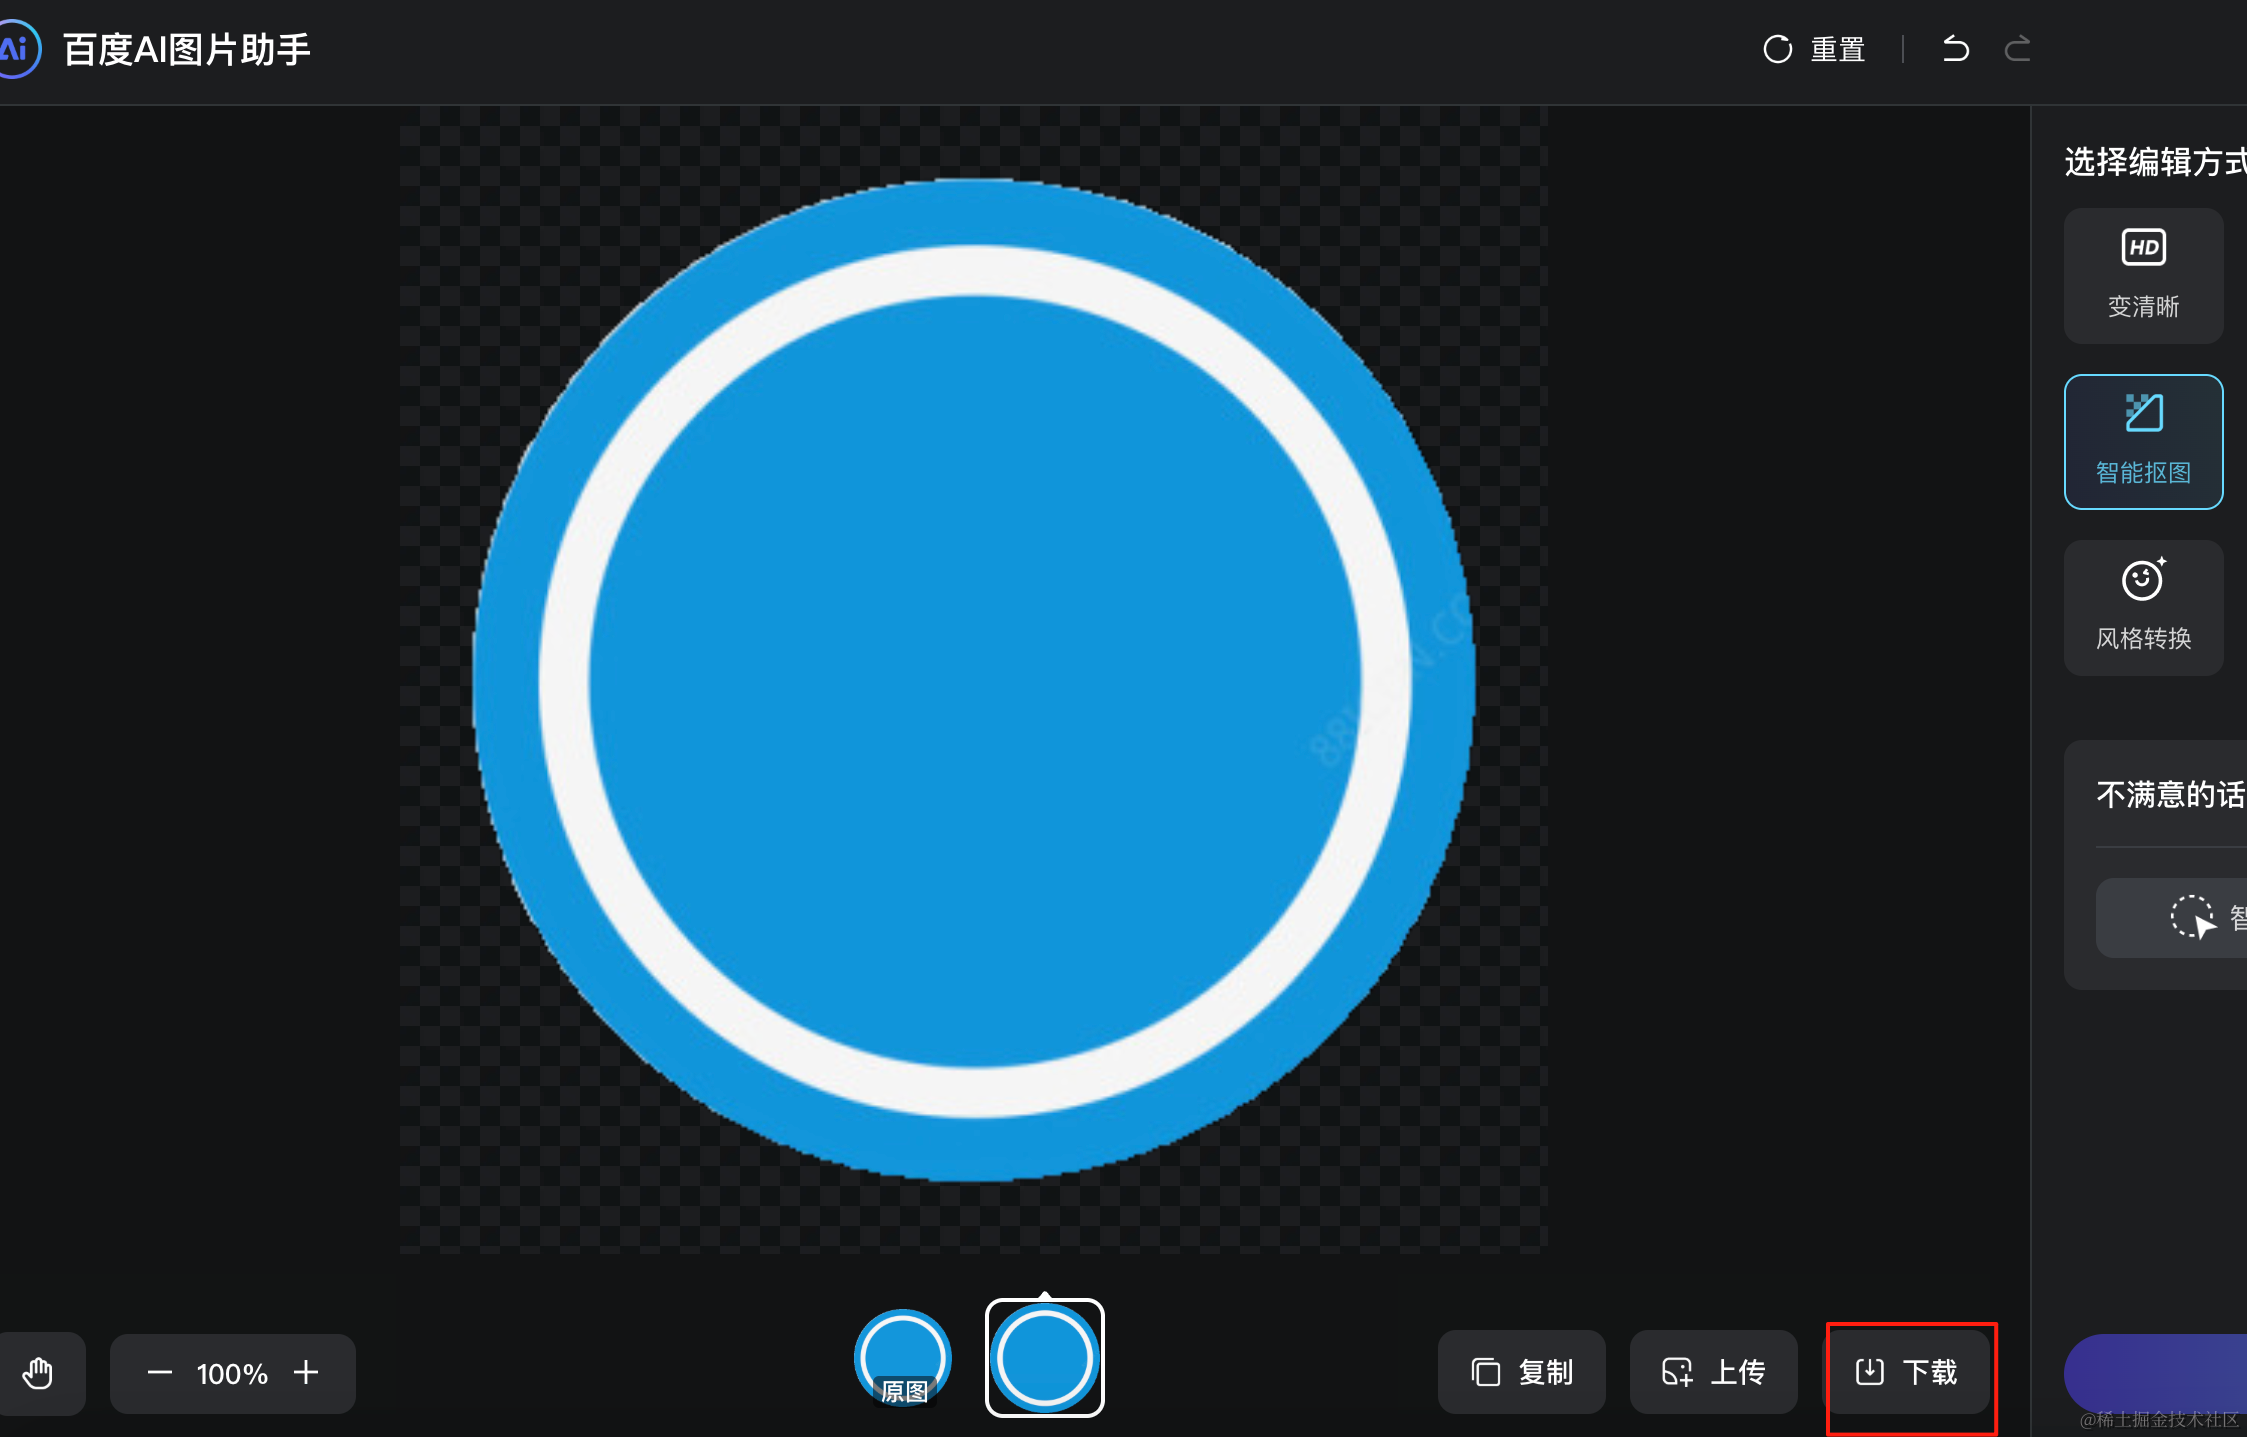
下载下来放 public 目录。
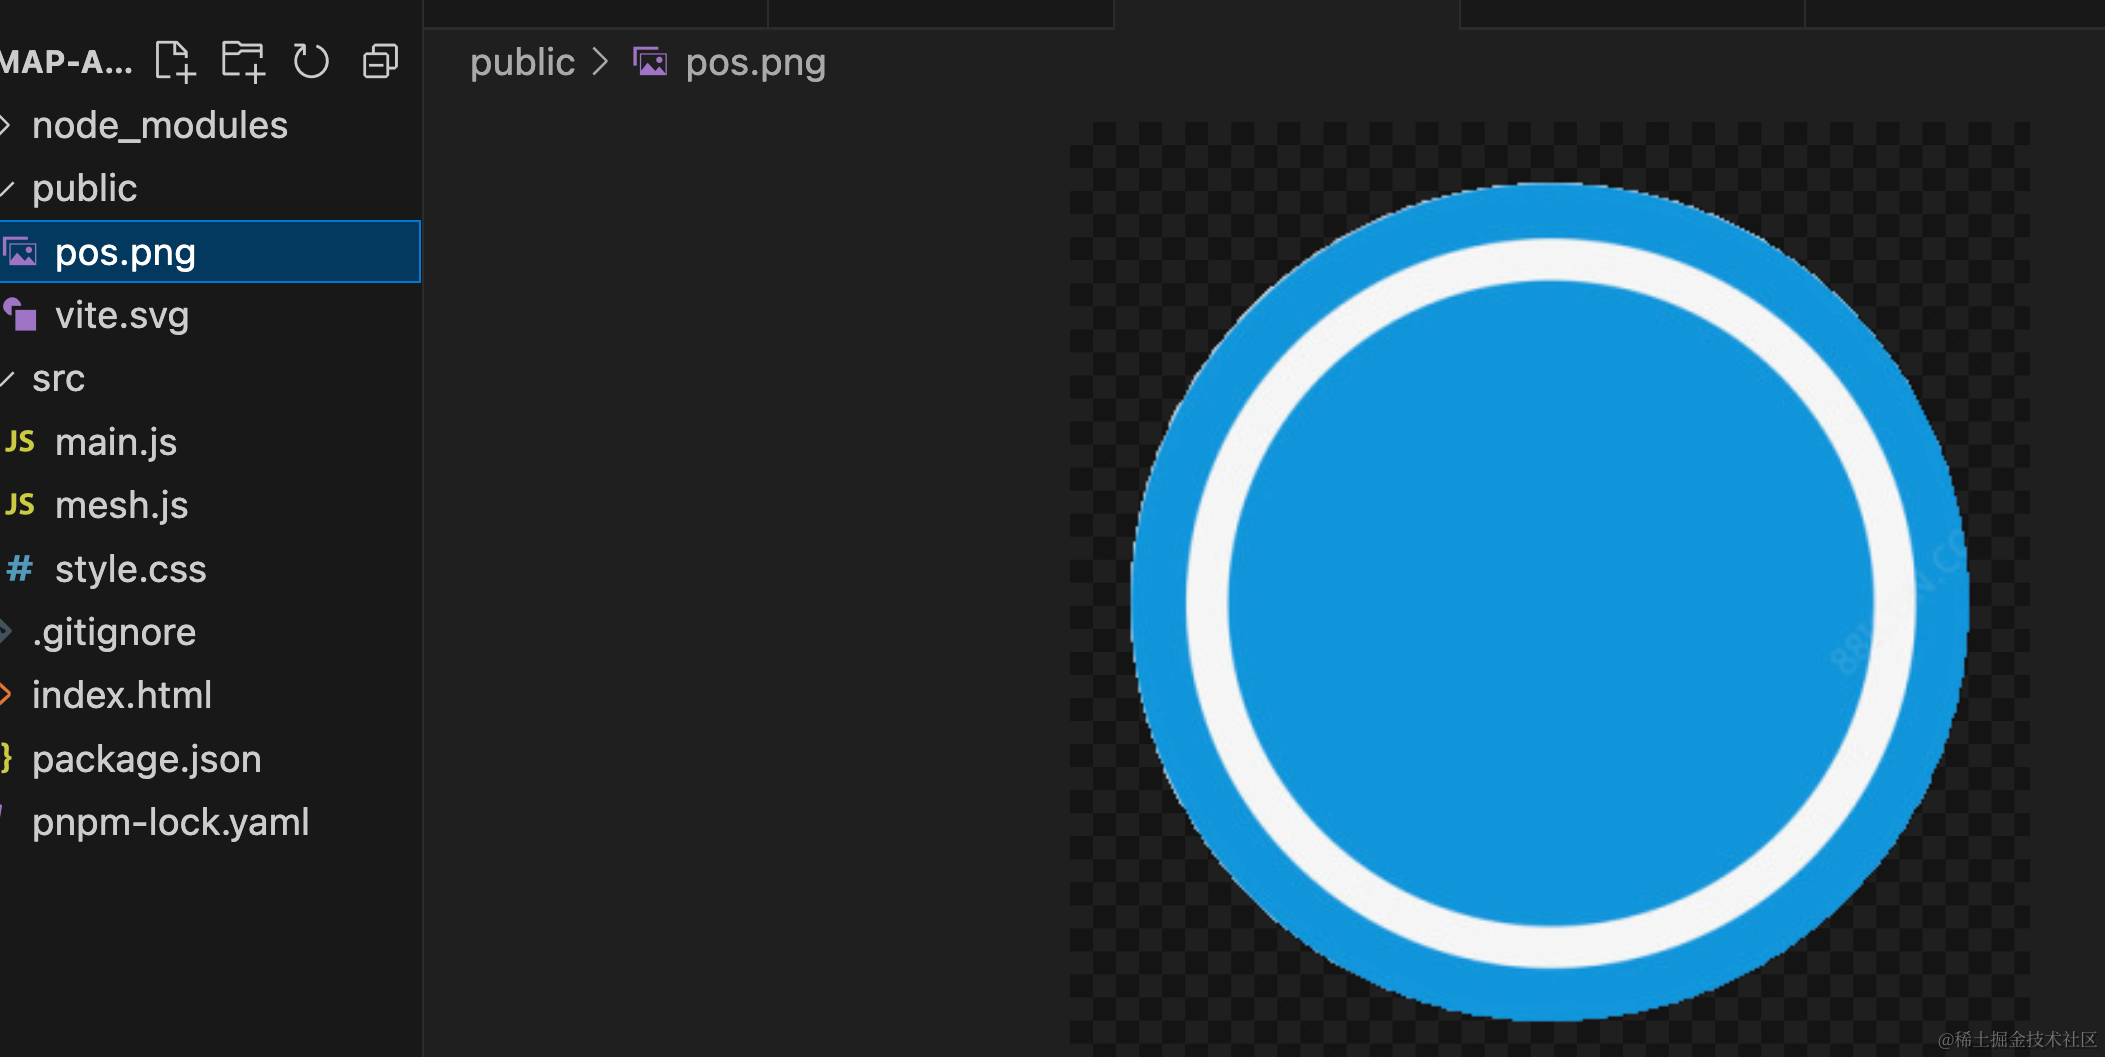
换成贴图的标注:
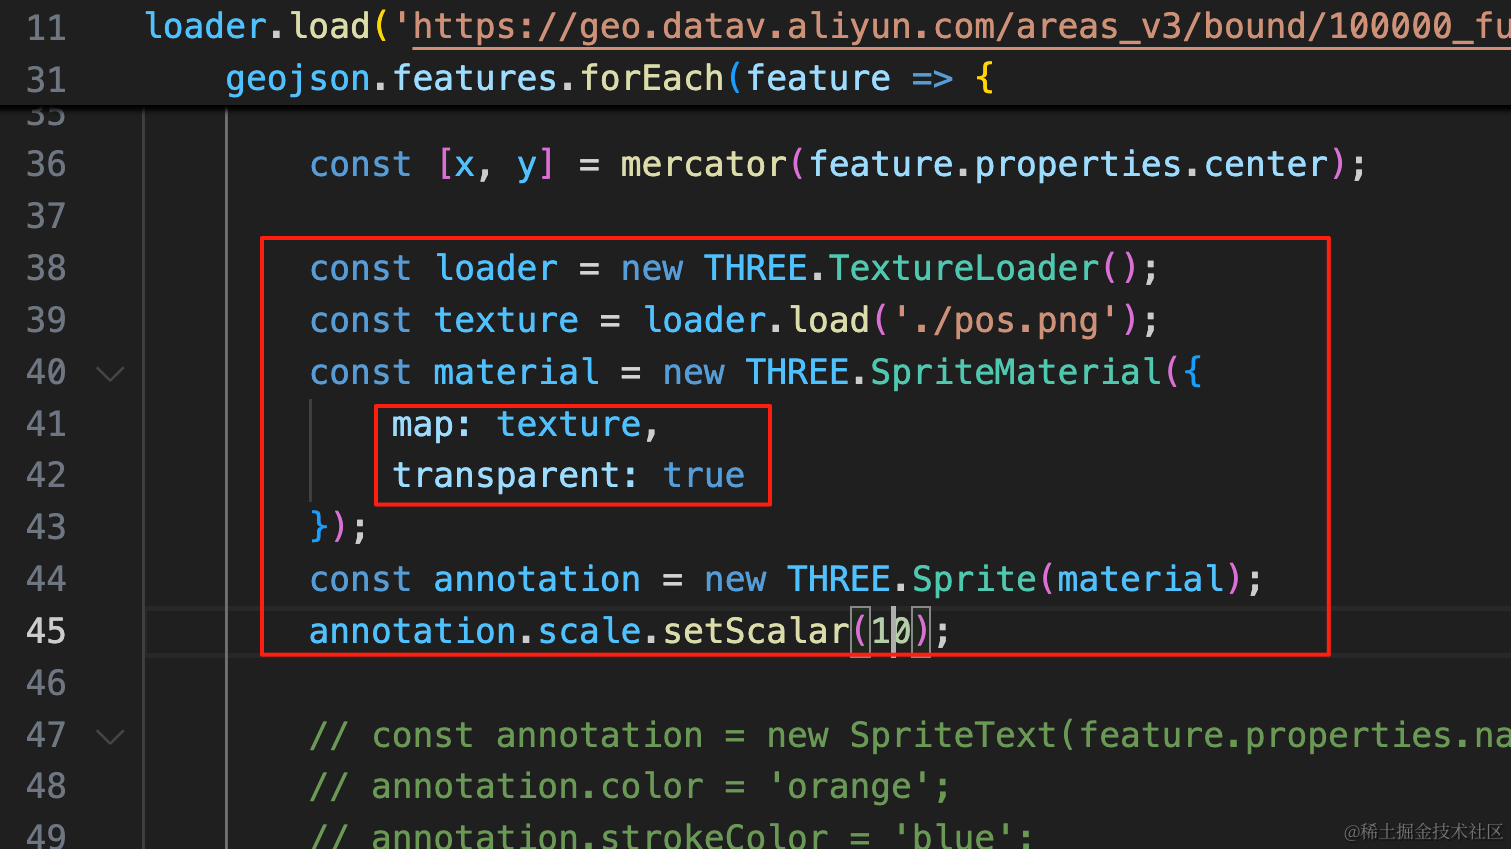
const loader = new THREE.TextureLoader();
const texture = loader.load('./pos.png');
const material = new THREE.SpriteMaterial({
    map: texture,
    transparent: true
});
const annotation = new THREE.Sprite(material);
annotation.scale.setScalar(10);
然后 mouseover 的时候,如果是 Sprite 就展示它对应的省的名字
我们先把名字画出来:
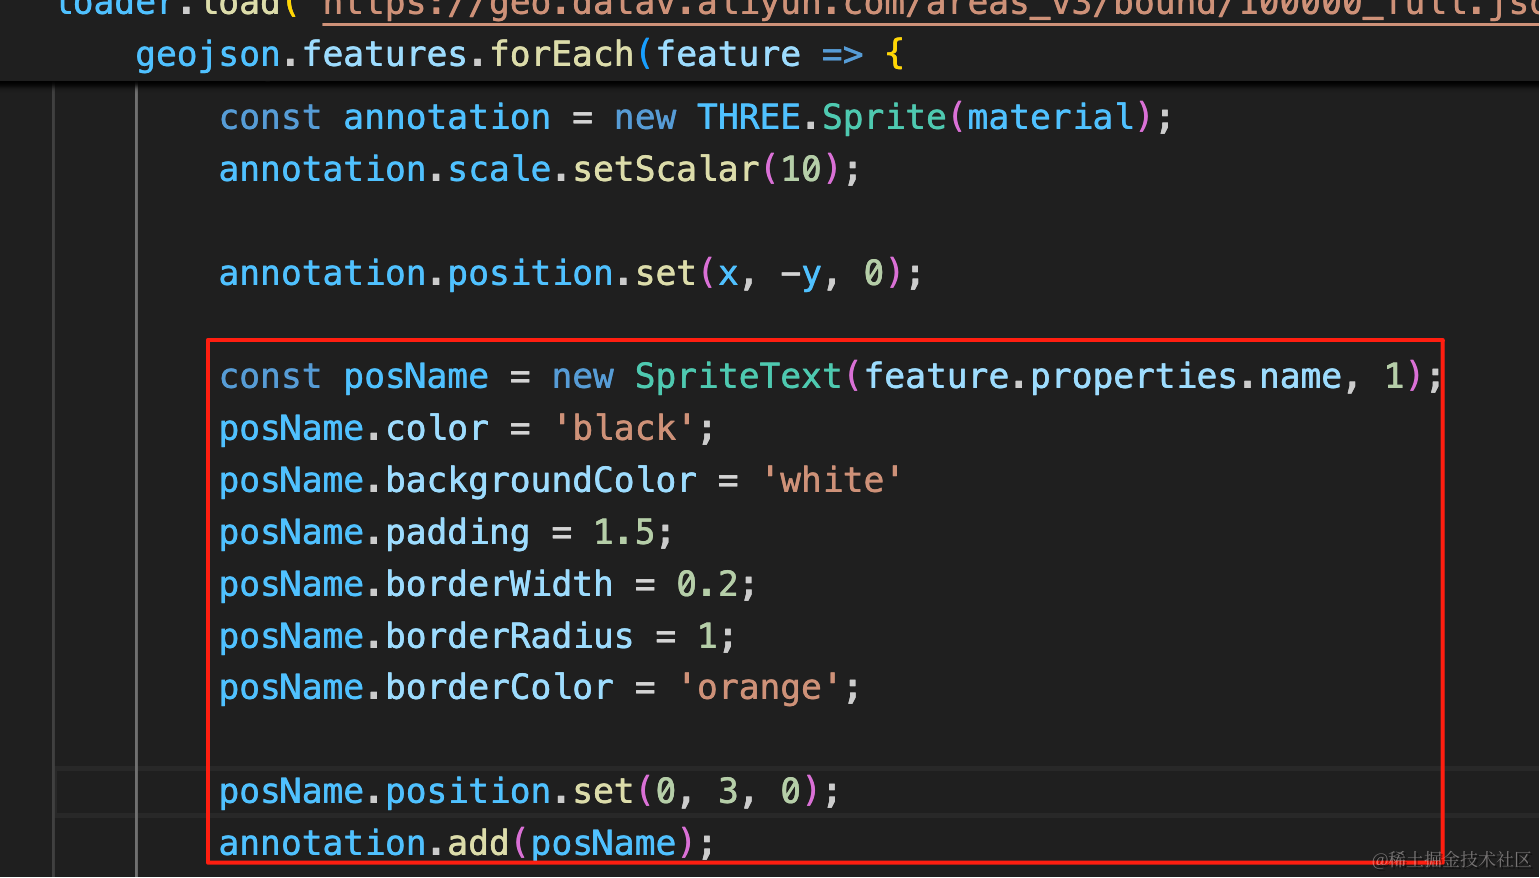
annotation.position.set(x, -y, 0);

const posName = new SpriteText(feature.properties.name, 1);
posName.color = 'black';
posName.backgroundColor = 'white'
posName.padding = 1.5;
posName.borderWidth = 0.2;
posName.borderRadius = 1;
posName.borderColor = 'orange';

posName.position.set(0, 3, 0);
annotation.add(posName);
因为整体放大了 10 倍,所以这个数值比较小。
调下样式,看看效果:
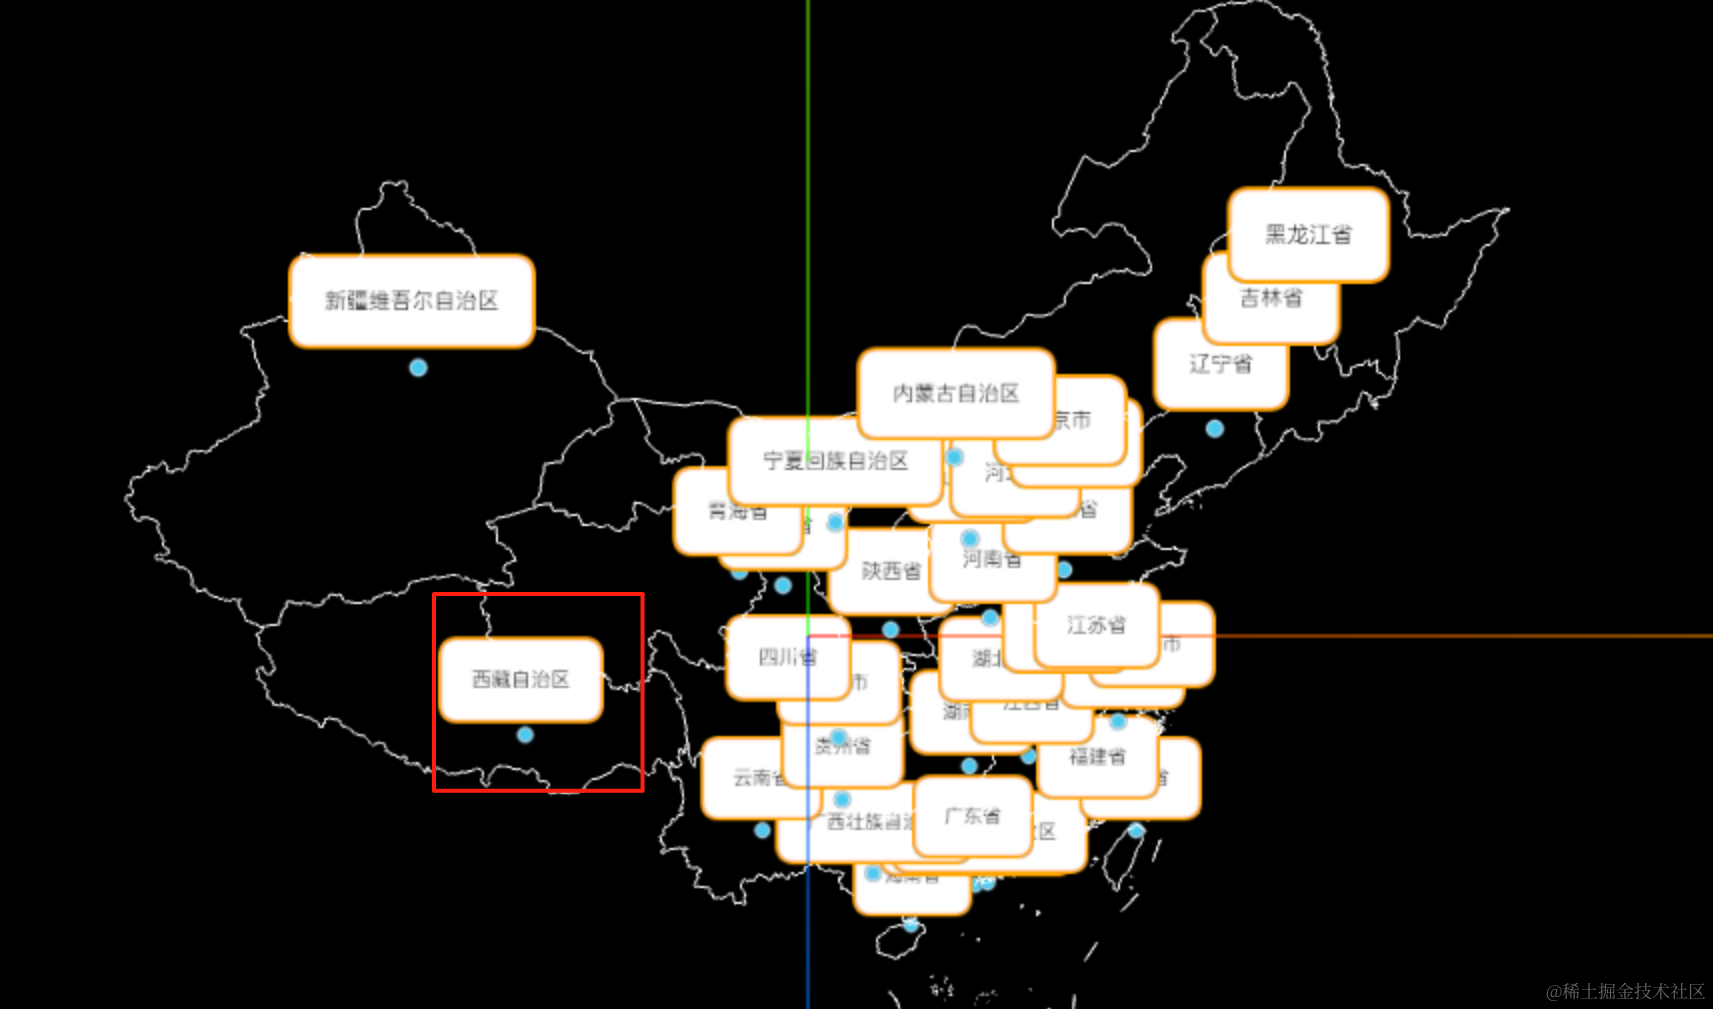
可以看到,在每个圆点上方,都有了一个文字的展示。
然后去掉这里的展示,我们点击的时候再添加:
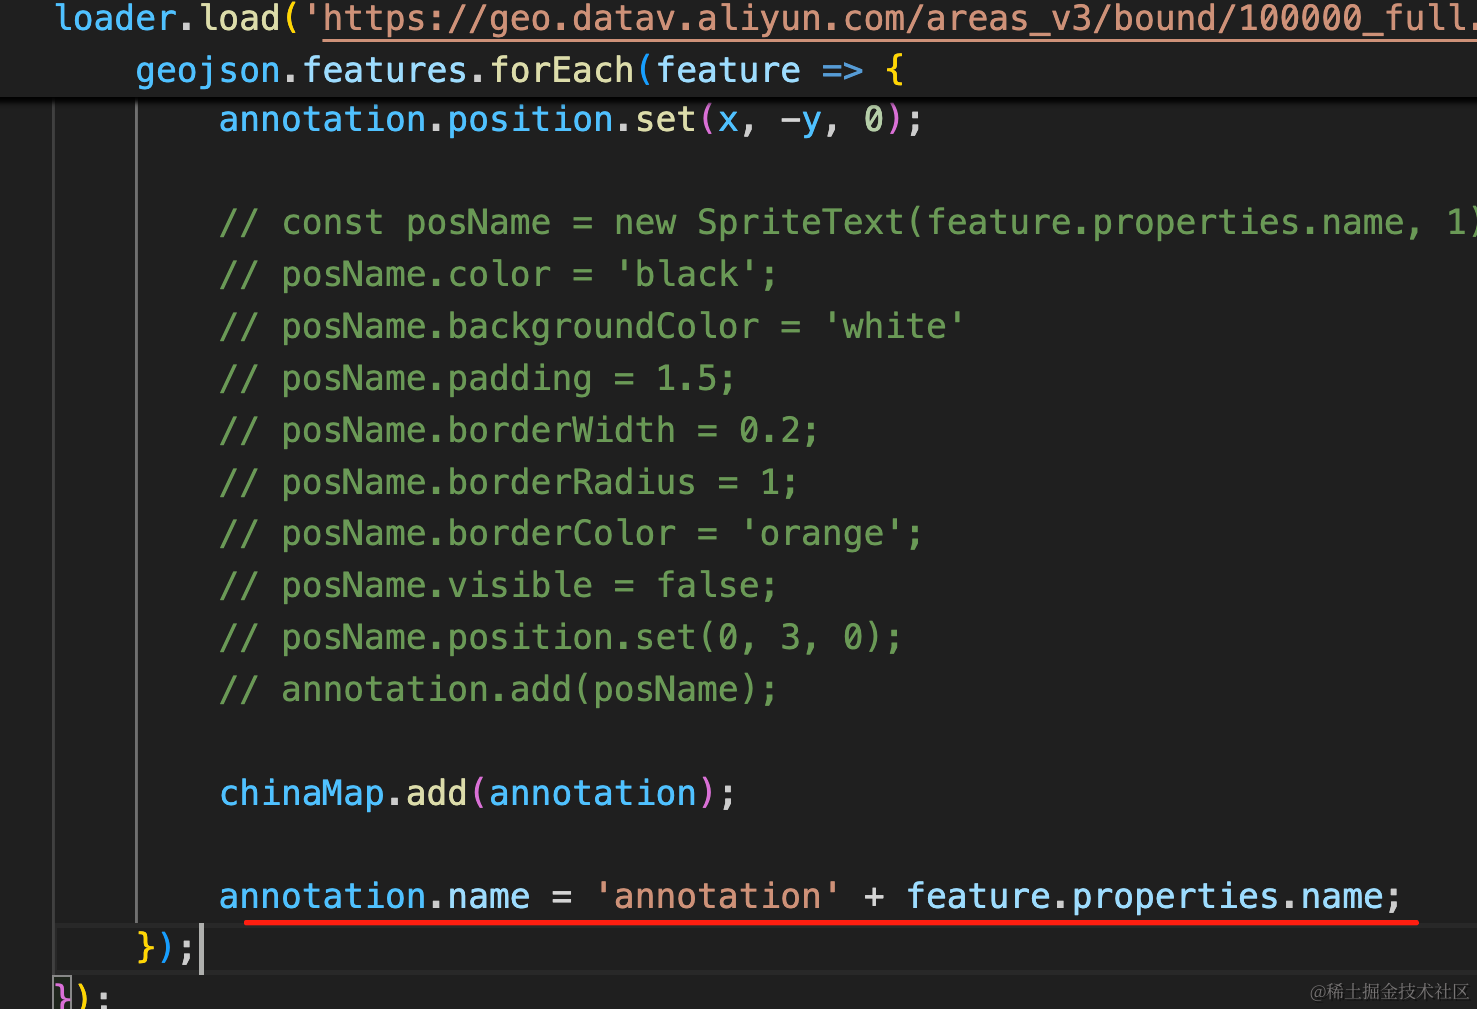
annotation.name = 'annotation' + feature.properties.name;加一个 name
main.js 里加一下点击的处理:
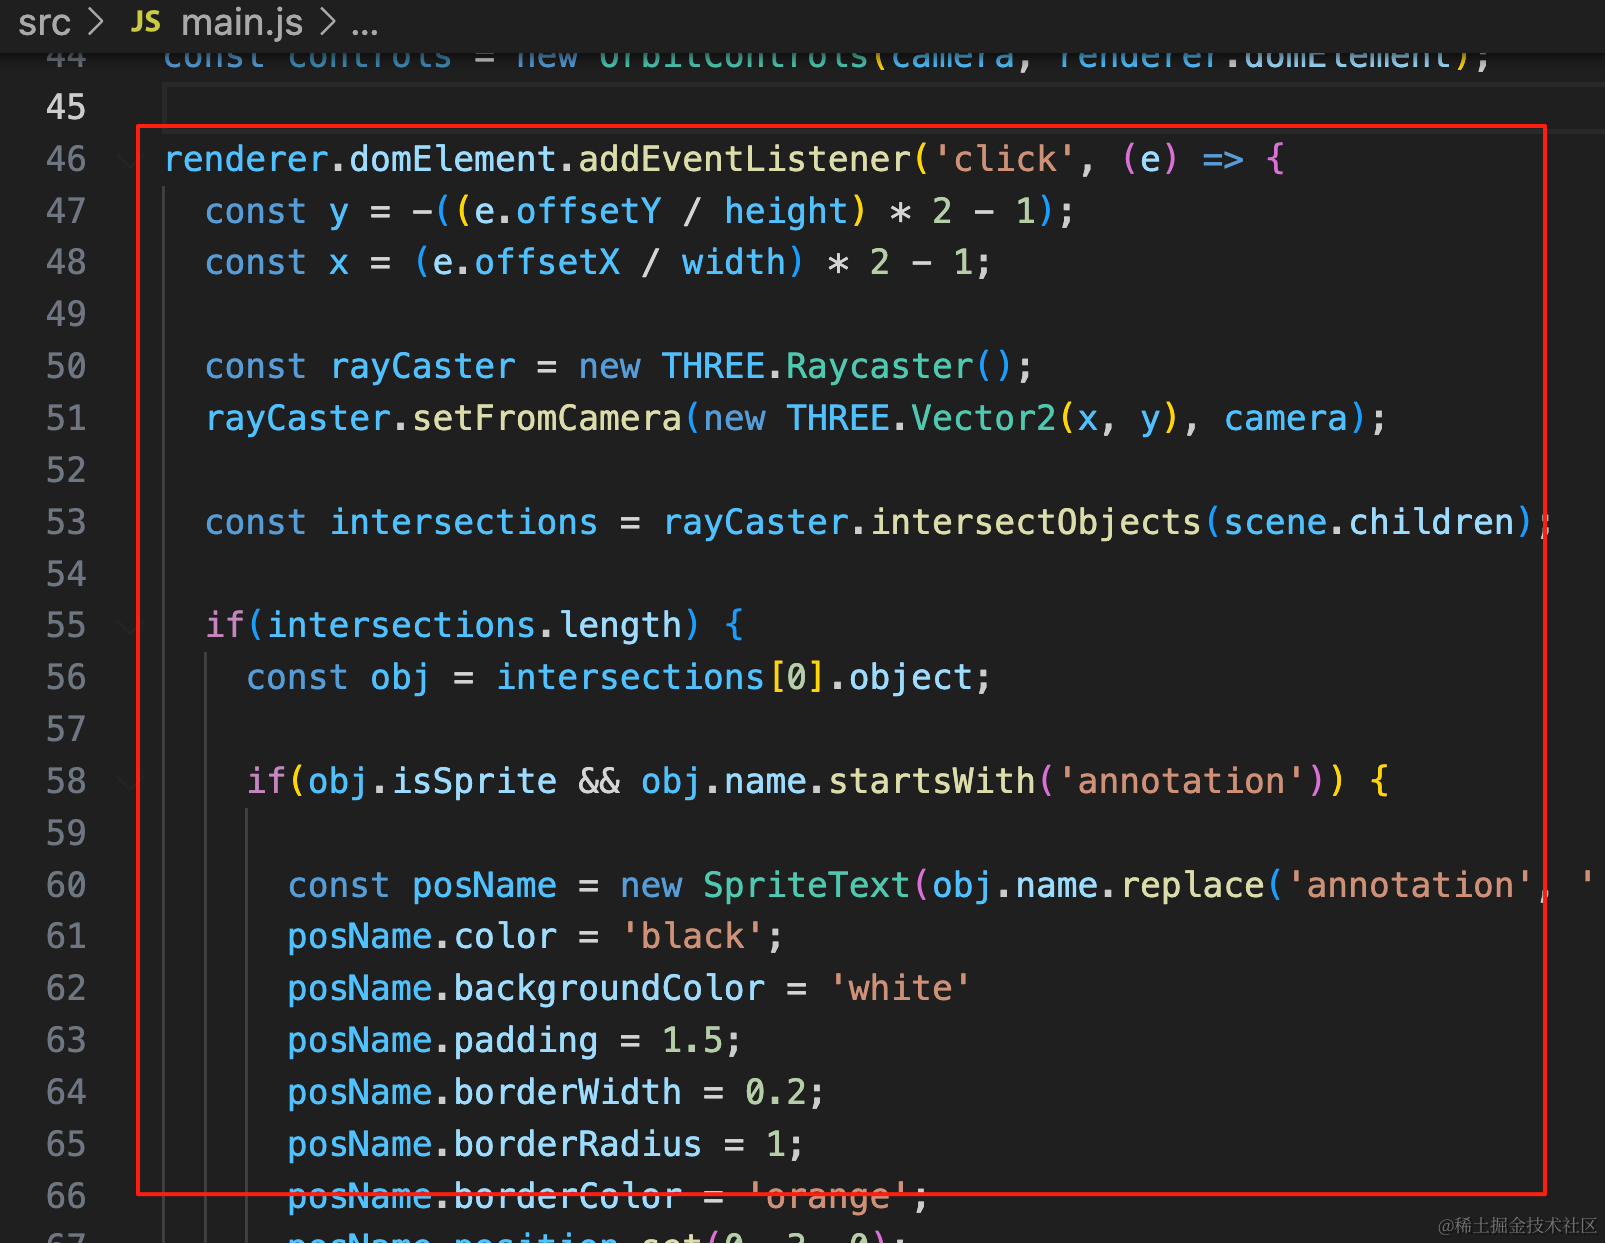
renderer.domElement.addEventListener('click', (e) => {
  const y = -((e.offsetY / height) * 2 - 1);
  const x = (e.offsetX / width) * 2 - 1;

  const rayCaster = new THREE.Raycaster();
  rayCaster.setFromCamera(new THREE.Vector2(x, y), camera);

  const intersections = rayCaster.intersectObjects(scene.children);

  if(intersections.length) {
    const obj = intersections[0].object;

    if(obj.isSprite && obj.name.startsWith('annotation')) {

      const posName = new SpriteText(obj.name.replace('annotation', ''), 1);
      posName.color = 'black';
      posName.backgroundColor = 'white'
      posName.padding = 1.5;
      posName.borderWidth = 0.2;
      posName.borderRadius = 1;
      posName.borderColor = 'orange';
      posName.position.set(0, 3, 0);
      obj.add(posName);
    }
  }
});
点击的时候,在那个位置加一个 SpriteText
试试效果:
然后点击一个省的时候,把其他省的标签隐藏。
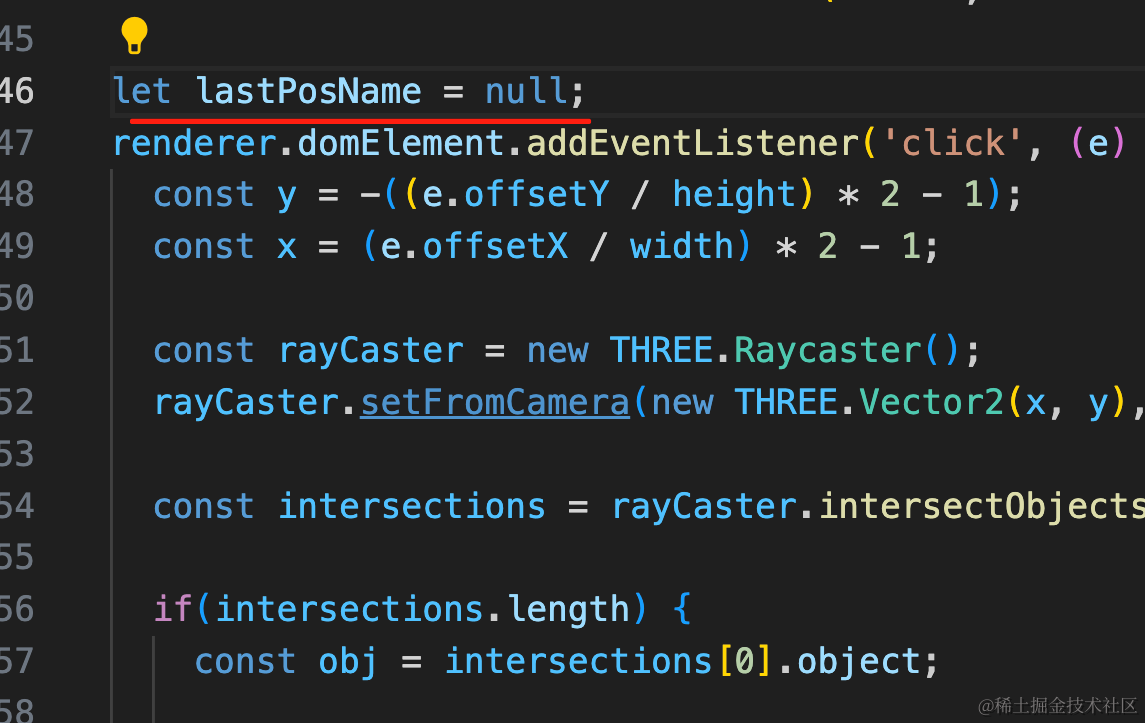
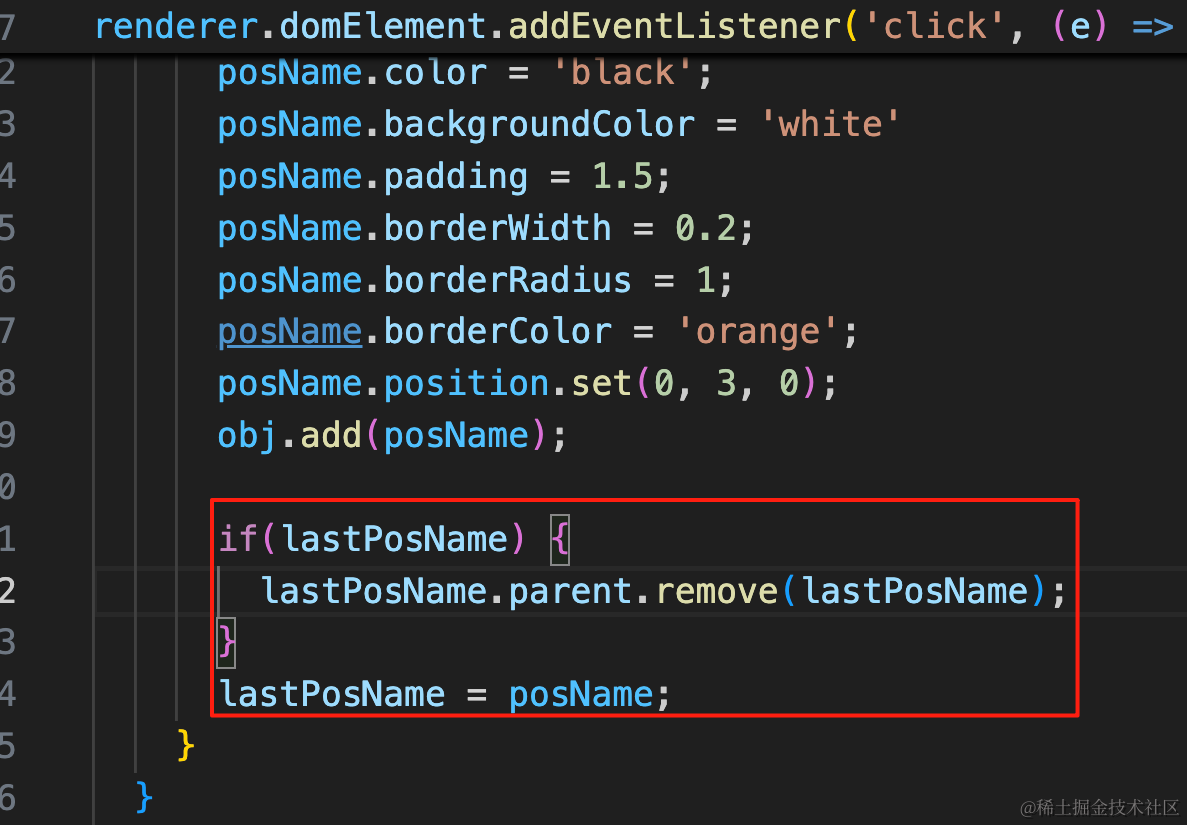
let lastPosName = null; if(lastPosName) {
lastPosName.parent.remove(lastPosName);
}
lastPosName = posName;试一下:
有的会被挡住:
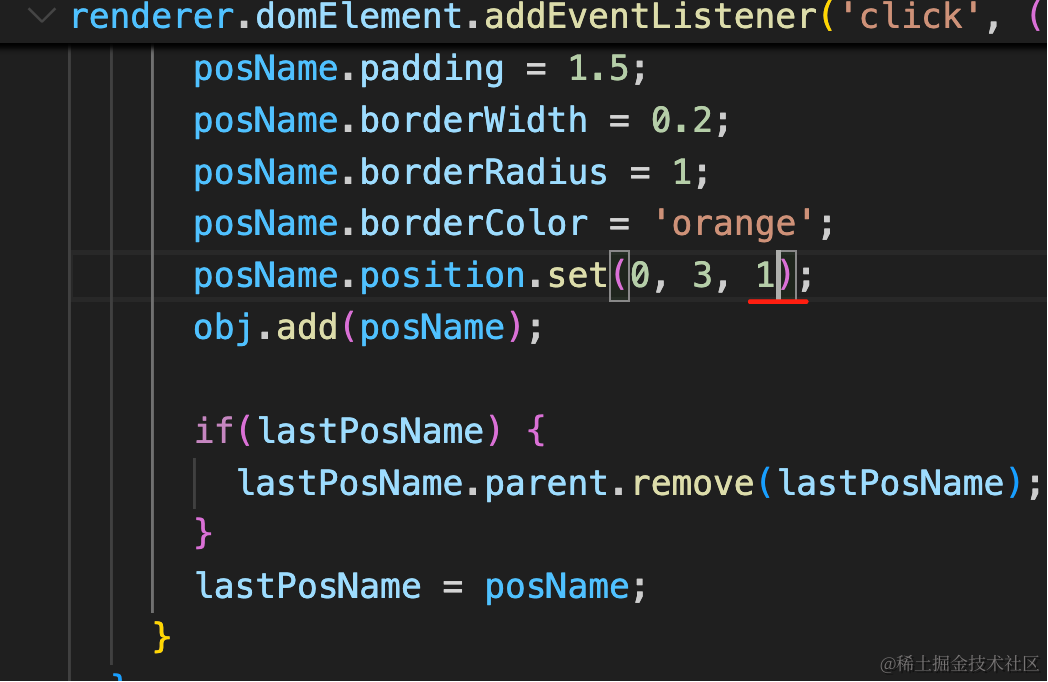
改一下 z 就好了。
放大一点:
这样就好了。
案例代码上传了小册仓库
总结
这节我们实现了地图标注。
geojson 里有省的中心位置经纬度,用墨卡托转换转为平面坐标,然后在那个位置加一个 Sprite 图标就好了。
点击 Sprite 的时候,在它上面加一个详细信息的框。
当然,这是最简单的标注,其实在这个位置画什么来标注都可以。