上节美化了一下地图:
这节我们继续来加功能。
首先要把人口的数量标注出来。
这个标注可以用 SpriteText,也可以用 CSS3DObject 来做。
这里我们还是用 SpriteText。
安装下:
pnpm install --save three-spritetext在柱子上加一个标注:
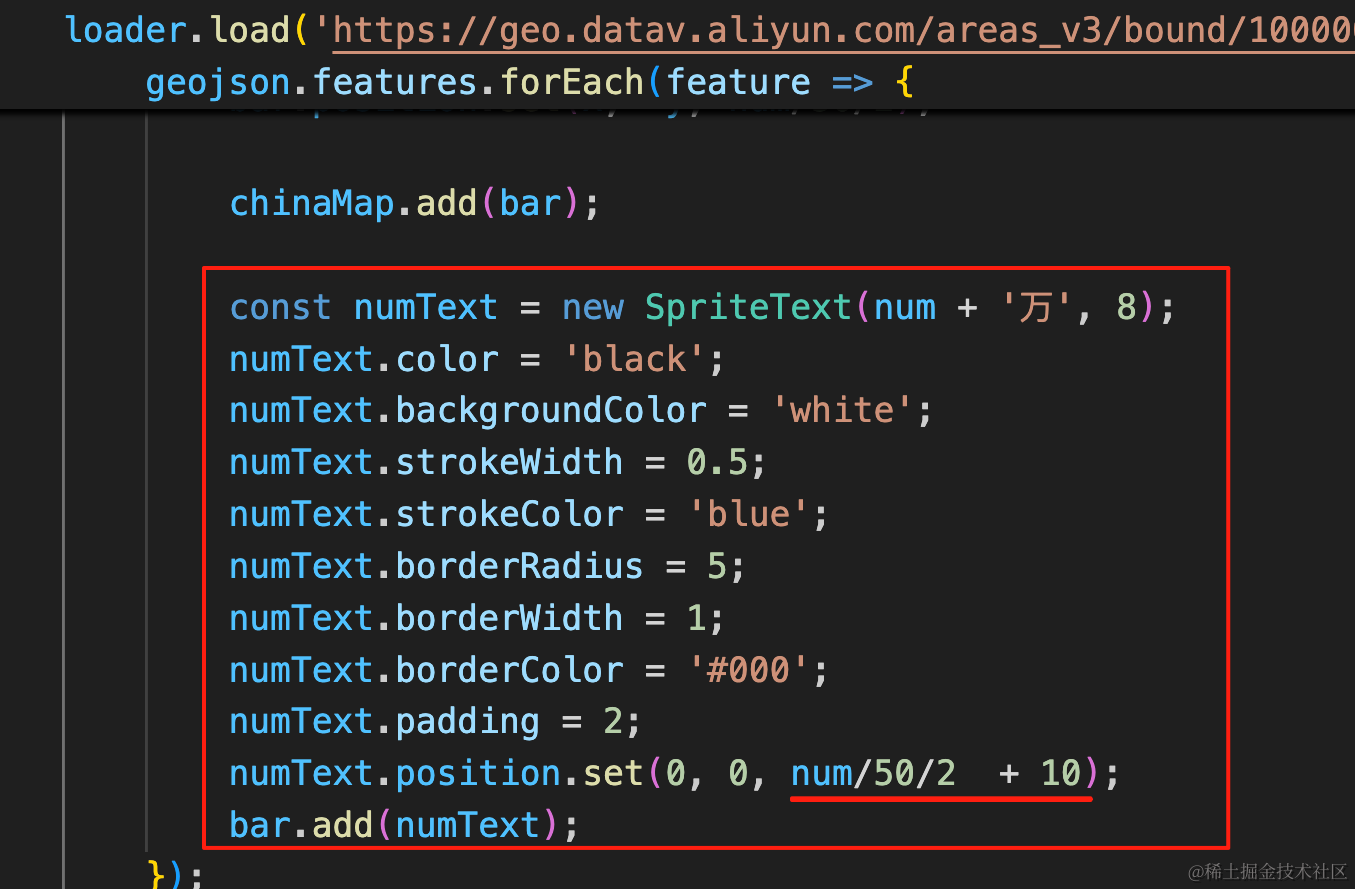
const numText = new SpriteText(num + '万', 8);
numText.color = 'black';
numText.backgroundColor = 'white';
numText.strokeWidth = 0.5;
numText.strokeColor = 'blue';
numText.borderRadius = 5;
numText.borderWidth = 1;
numText.borderColor = '#000';
numText.padding = 2;
numText.position.set(0, 0, num/50/2  + 10);
bar.add(numText);
位置在柱子的高度上方 10 的位置。
看下效果:
我们给柱子加一个出现的动画,高度从 0 到现在的高度。
用 gsap 来做:
pnpm install --save gsap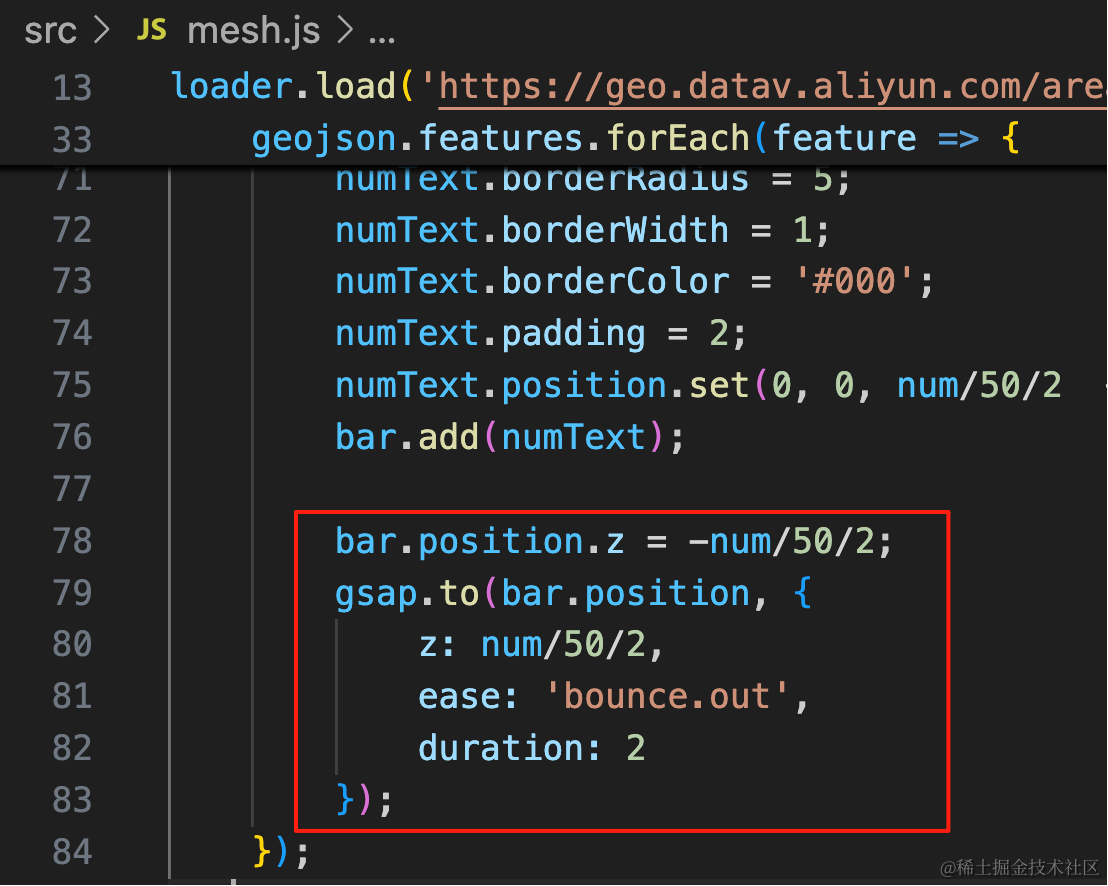
bar.position.z = -num/50/2;
gsap.to(bar.position, {
    z: num/50/2,
    ease: 'bounce.out',
    duration: 2
});
加一个出现时的动画,先把柱子放到地图下面,然后运动到地图上面。
这里改 scale.z 也可以。
看下效果:
然后把省的名字也标出来:
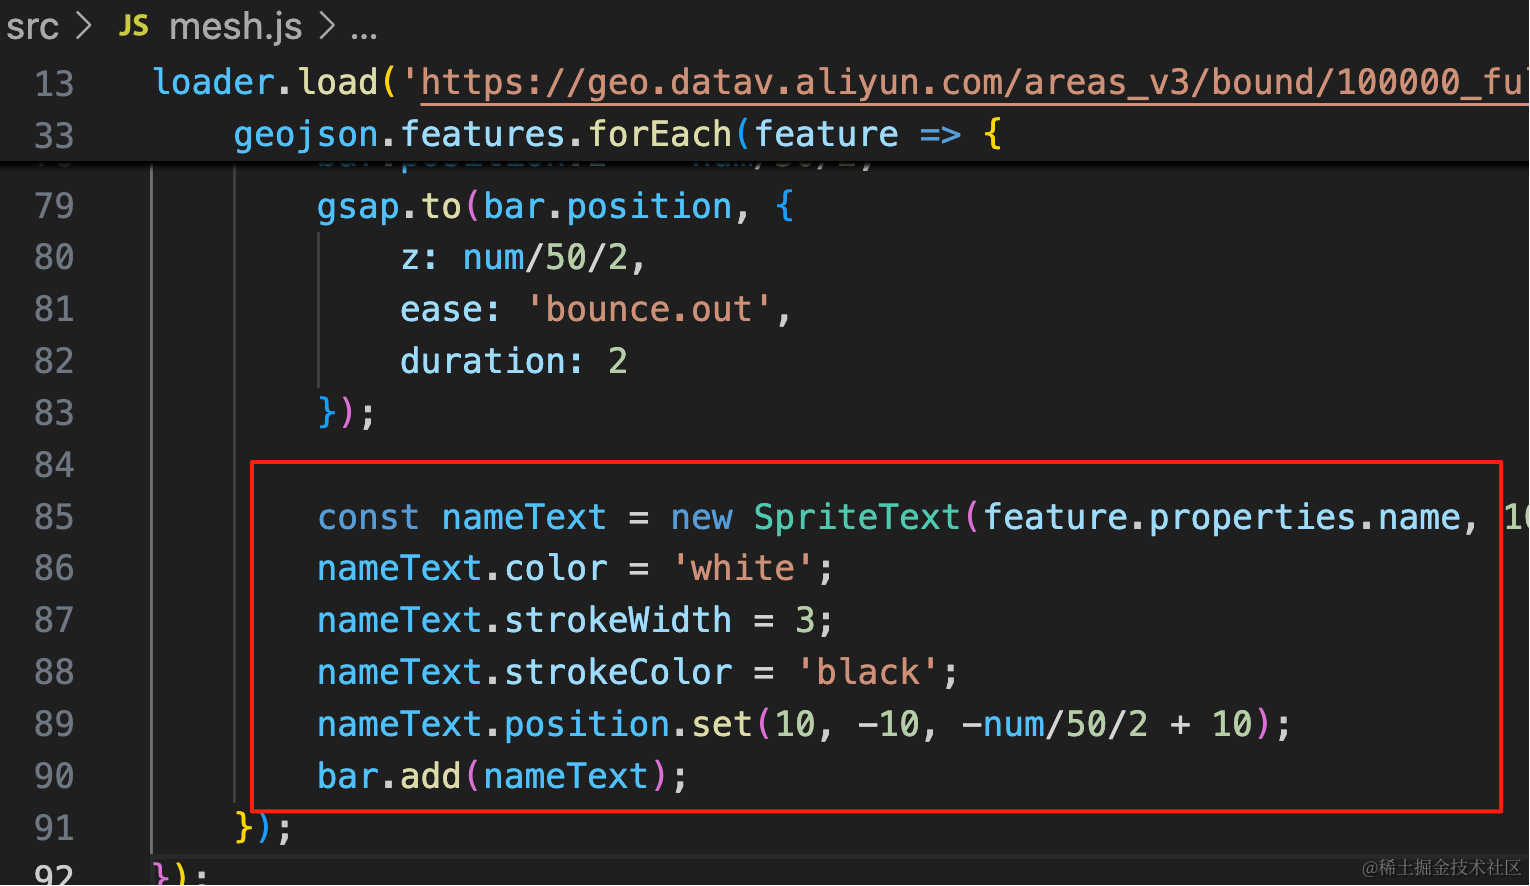
const nameText = new SpriteText(feature.properties.name, 10);
nameText.color = 'white';
nameText.strokeWidth = 3;
nameText.strokeColor = 'black';
nameText.position.set(10, -10, -num/50/2 + 10);
bar.add(nameText);
这个名字不需要跟着做动画,等动画完再显示就行。
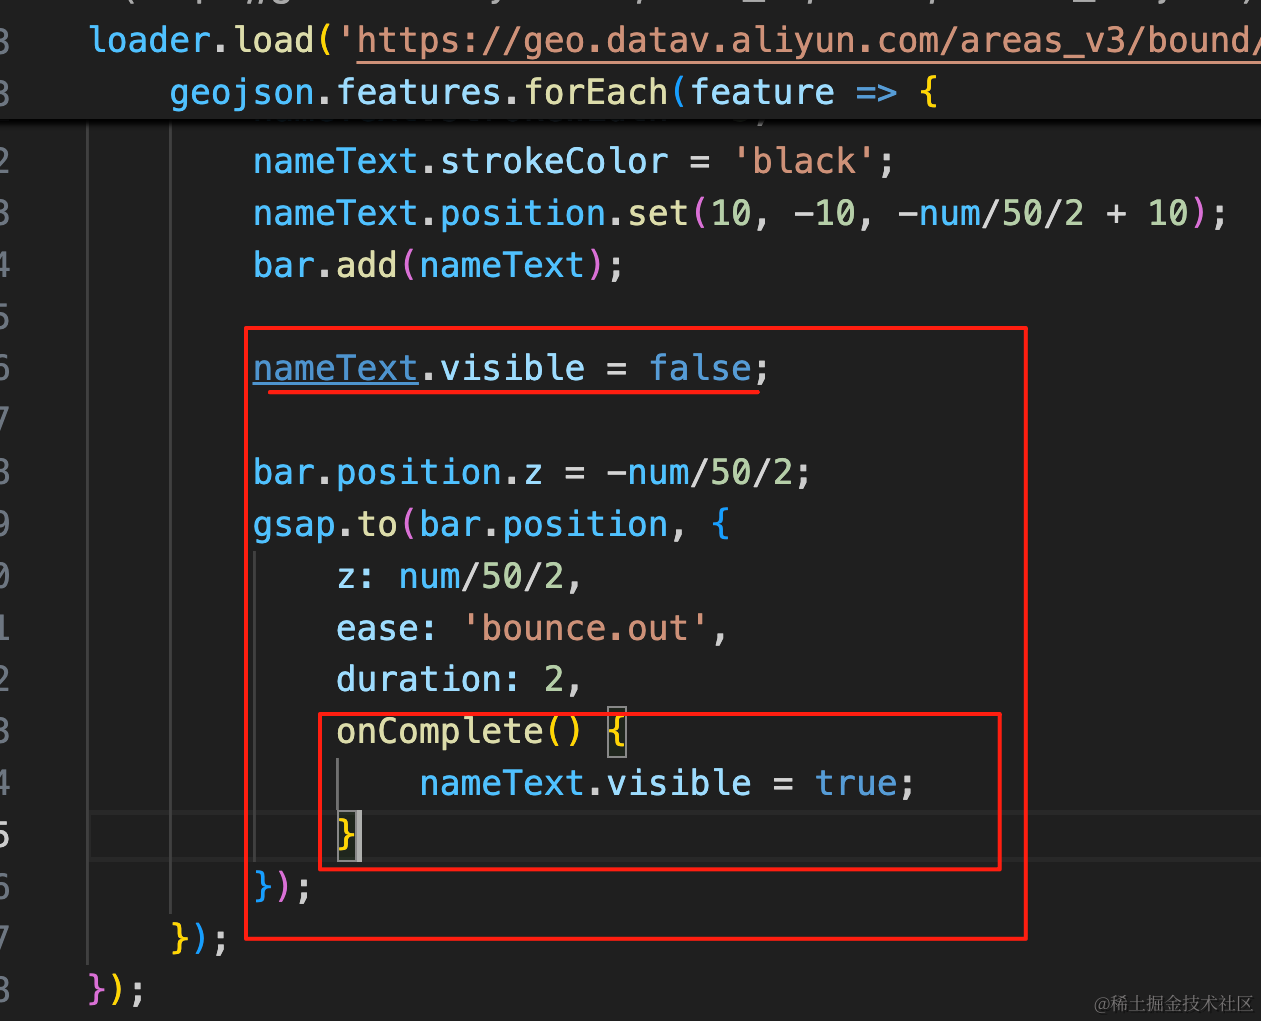
nameText.visible = false;

bar.position.z = -num/50/2;
gsap.to(bar.position, {
    z: num/50/2,
    ease: 'bounce.out',
    duration: 2,
    onComplete() {
        nameText.visible = true;
    }
});
这样,整体功能就差不多了。
去掉 AxesHelper,然后我们再加一些底部的装饰:
比如这种圆盘:

首先加一下背景:
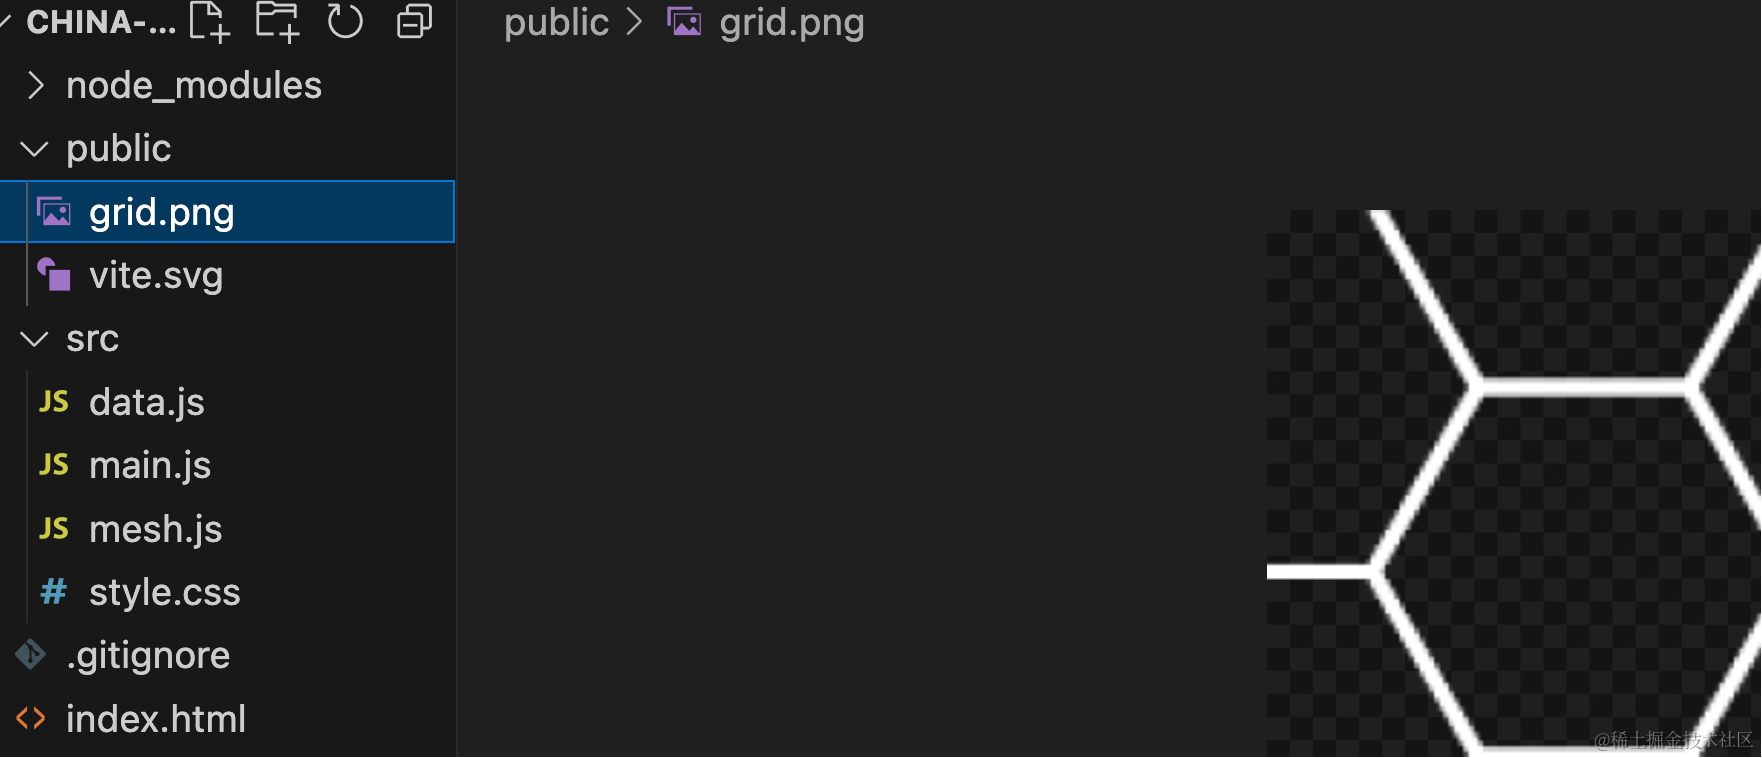
你可以从仓库里找到这张图片
然后用 PlaneGeometry 来画一下:
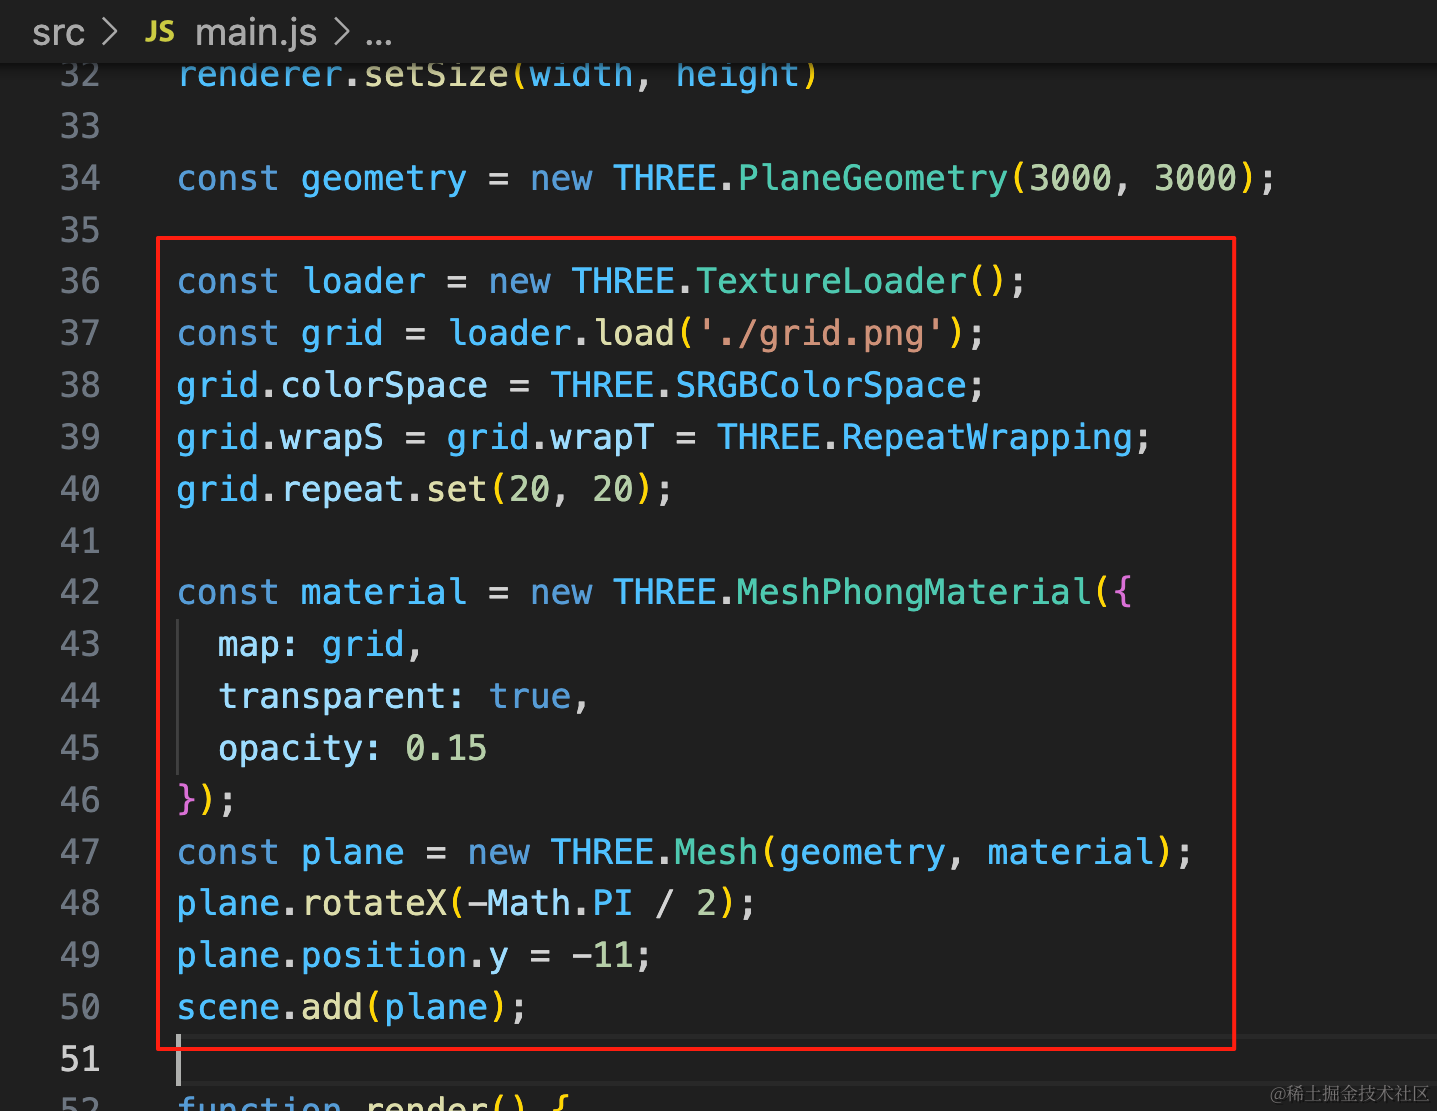
const geometry = new THREE.PlaneGeometry(3000, 3000);

const loader = new THREE.TextureLoader();
const grid = loader.load('./grid.png');
grid.colorSpace = THREE.SRGBColorSpace;
grid.wrapS = grid.wrapT = THREE.RepeatWrapping;
grid.repeat.set(20, 20);

const material = new THREE.MeshPhongMaterial({
  map: grid,
  transparent: true,
  opacity: 0.15
});
const plane = new THREE.Mesh(geometry, material);
plane.rotateX(-Math.PI / 2);
plane.position.y = -11;
scene.add(plane);
加一个 PlaneGeometry,重复设置这张图片,透明度设置低一点。

然后是圆盘:
这个其实用图片是最简单的,没有图片就自己画。
我们自己用曲线 API 画一下:
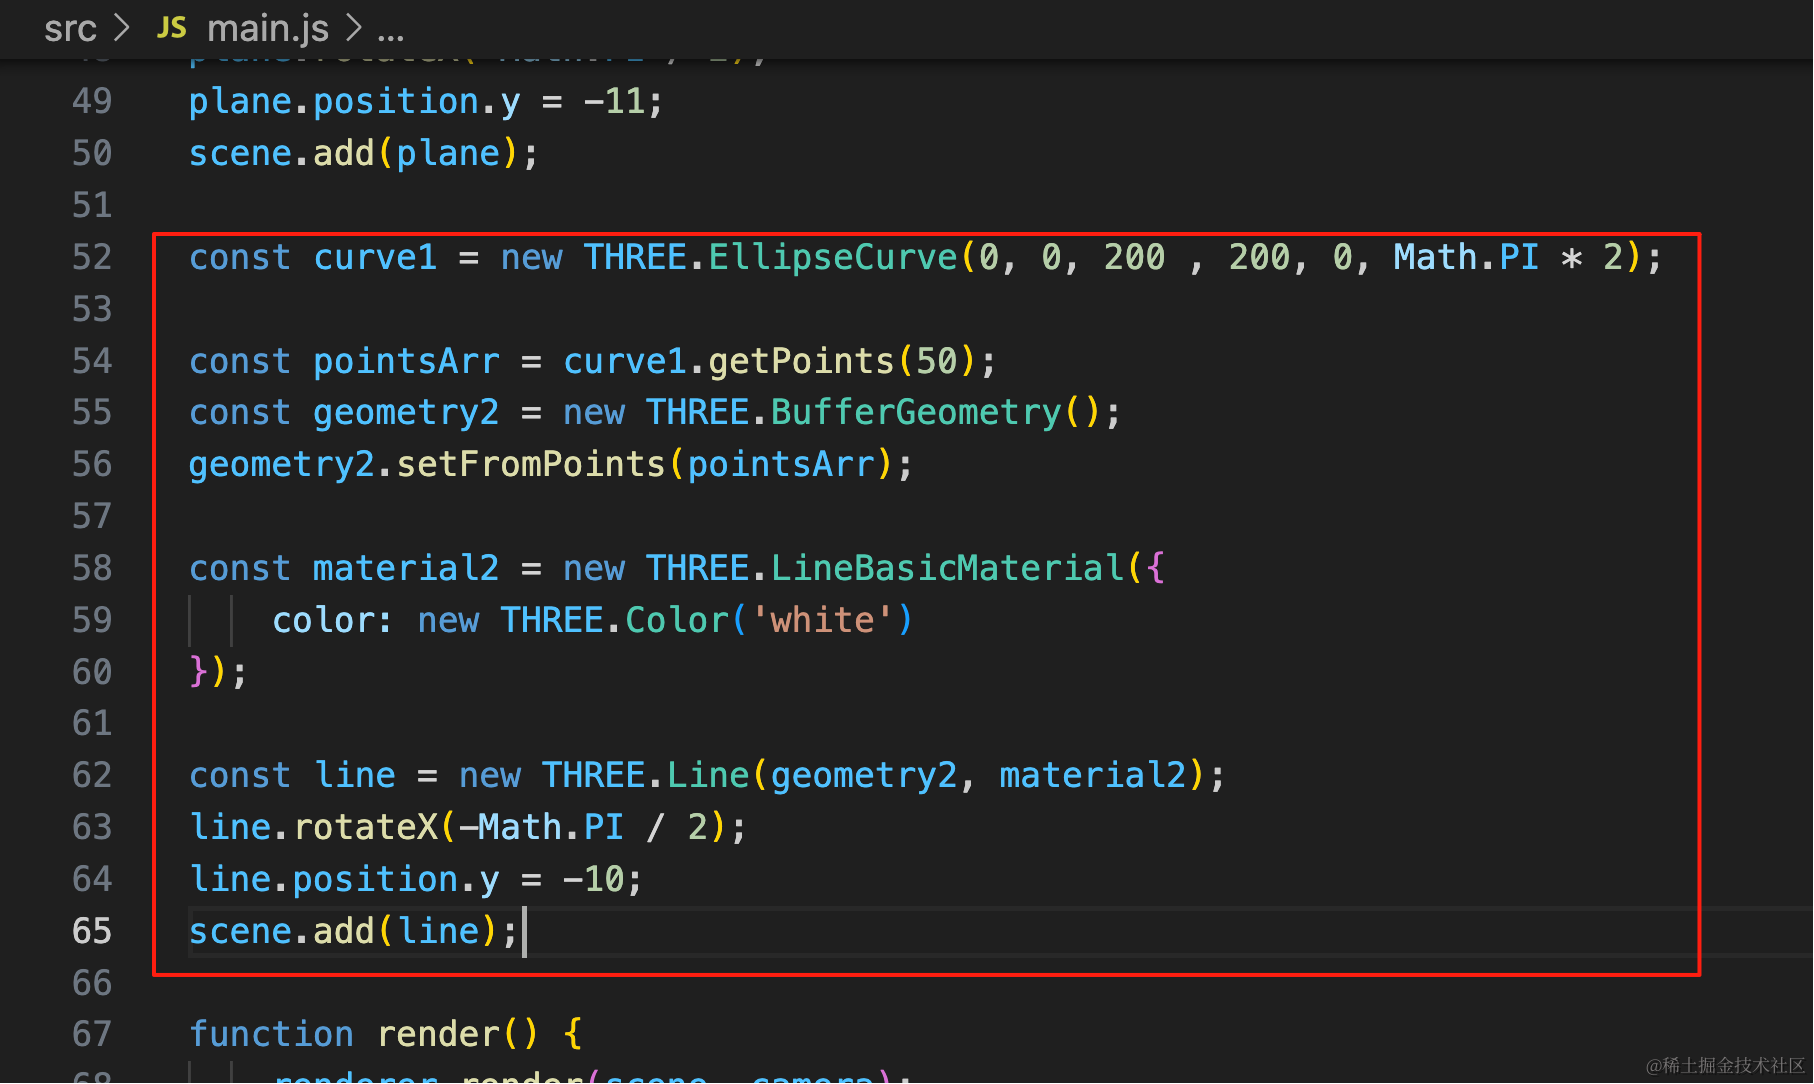
const curve1 = new THREE.EllipseCurve(0, 0, 200 , 200, 0, Math.PI * 2);

const pointsArr = curve1.getPoints(50);
const geometry2 = new THREE.BufferGeometry();
geometry2.setFromPoints(pointsArr);

const material2 = new THREE.LineBasicMaterial({
    color: new THREE.Color('white')
});

const line = new THREE.Line(geometry2, material2);
line.rotateX(-Math.PI / 2);
line.position.y = -10;
scene.add(line);
画一条曲线,取点设置到 BufferGeometry,然后用 Line 画出来。
加个循环,多画几条:
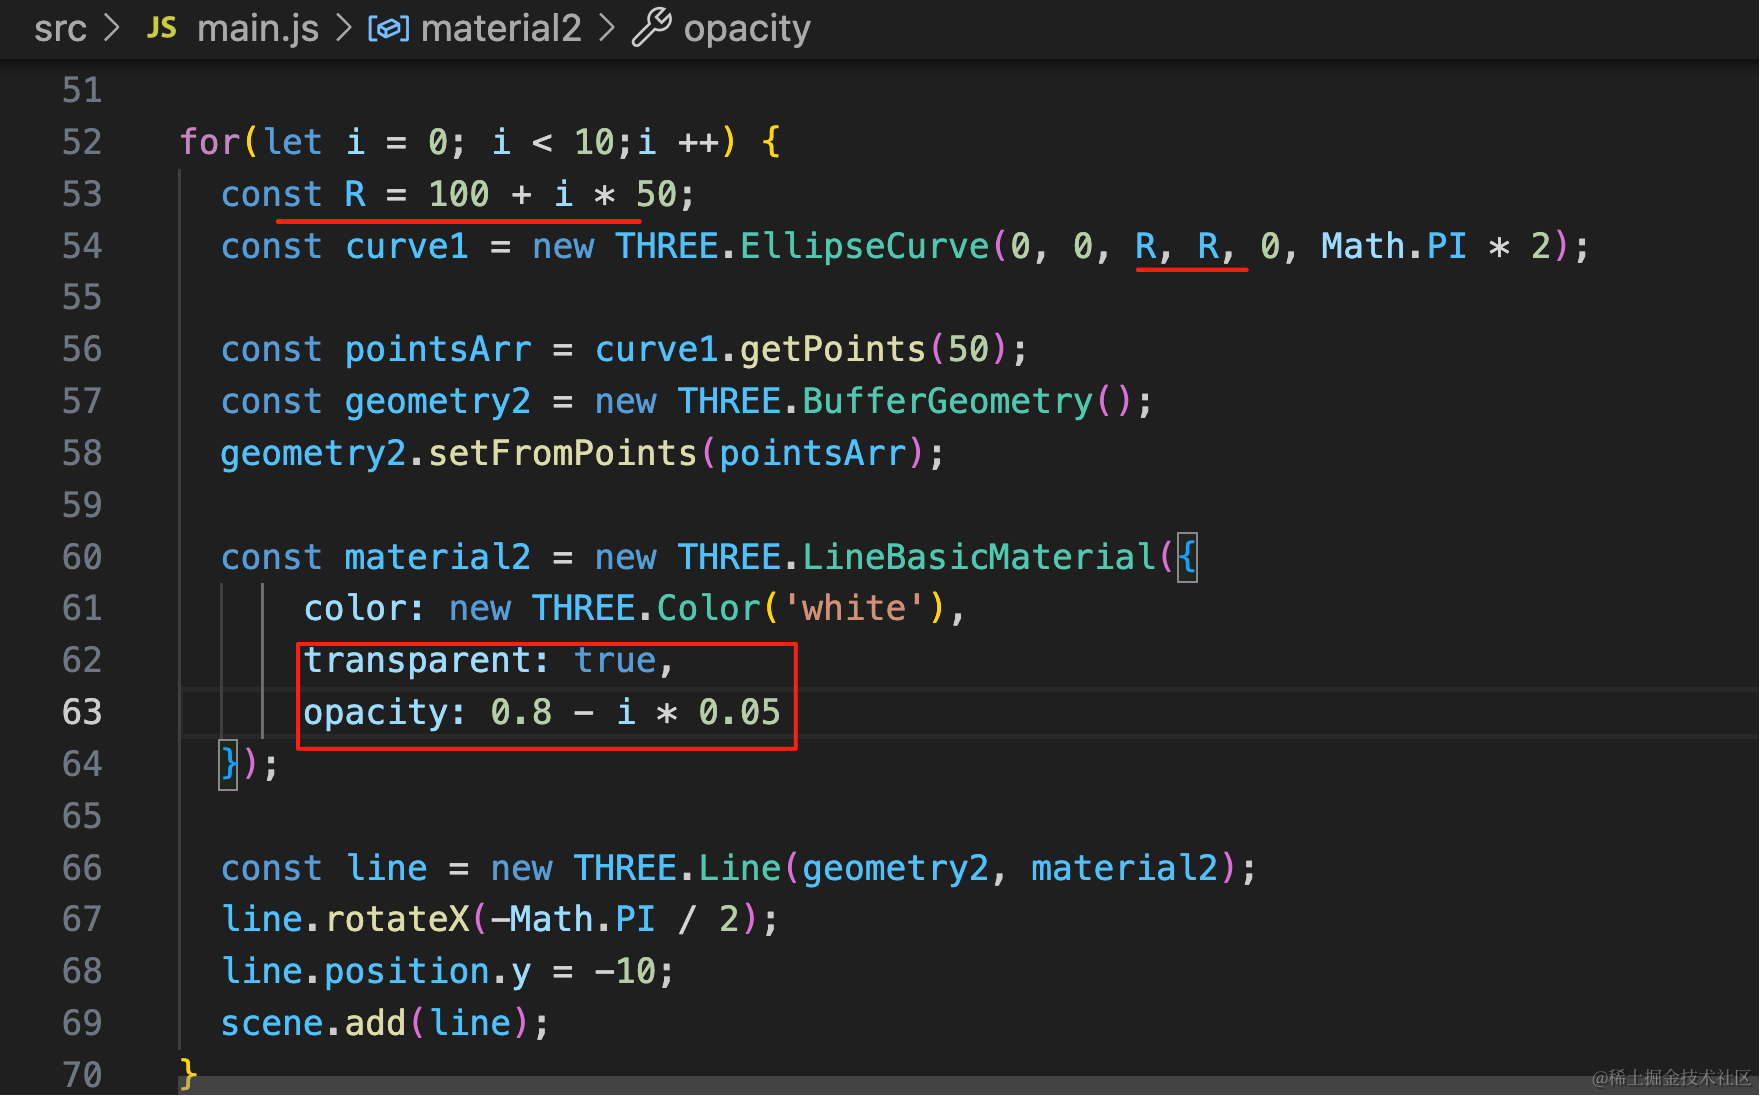
循环设置不同的半径和透明度
for(let i = 0; i < 10;i ++) {
  const R = 100 + i * 50;
  const curve1 = new THREE.EllipseCurve(0, 0, R, R, 0, Math.PI * 2);

  const pointsArr = curve1.getPoints(50);
  const geometry2 = new THREE.BufferGeometry();
  geometry2.setFromPoints(pointsArr);

  const material2 = new THREE.LineBasicMaterial({
      color: new THREE.Color('white'),
      transparent: true,
      opacity: 0.8 - i * 0.05
  });

  const line = new THREE.Line(geometry2, material2);
  line.rotateX(-Math.PI / 2);
  line.position.y = -10;
  scene.add(line);
}
看下效果:
还可以画外面这种:
用 LineSegments 就行
BufferGeometry 存一堆点,然后用 LineSegments 两两连接
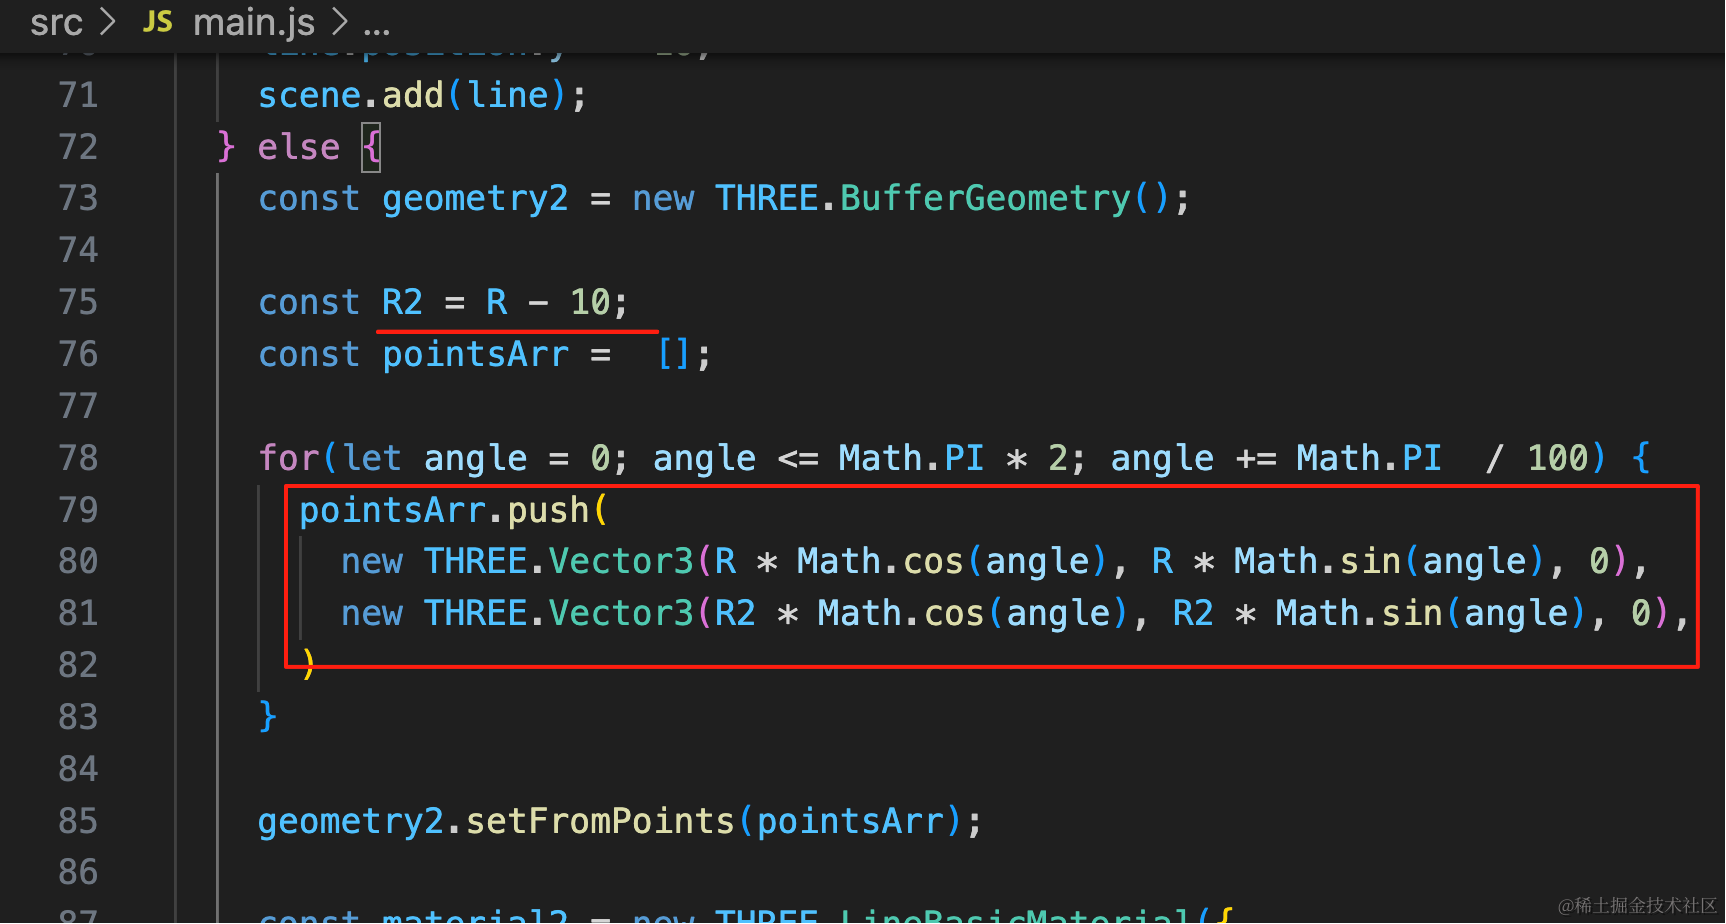
大概这样,先计算小一圈的 R2,
然后角度从 0 到 360 度,分别计算 cos、sin,的两个值
for(let i = 0; i < 10;i ++) {
const R = 100 + i * 50;
if(i % 2 === 0) {
const curve1 = new THREE.EllipseCurve(0, 0, R, R, 0, Math.PI * 2);
const pointsArr = curve1.getPoints(50);
const geometry2 = new THREE.BufferGeometry();
geometry2.setFromPoints(pointsArr);
const material2 = new THREE.LineBasicMaterial({
color: new THREE.Color('white'),
transparent: true,
opacity: 0.8 - i * 0.05
});
const line = new THREE.Line(geometry2, material2);
line.rotateX(-Math.PI / 2);
line.position.y = -10;
scene.add(line);
} else {
const geometry2 = new THREE.BufferGeometry();
const R2 = R - 10;
const pointsArr = [];
for(let angle = 0; angle <= Math.PI * 2; angle += Math.PI / 100) {
pointsArr.push(
new THREE.Vector3(R * Math.cos(angle), R * Math.sin(angle), 0),
new THREE.Vector3(R2 * Math.cos(angle), R2 * Math.sin(angle), 0),
)
}
geometry2.setFromPoints(pointsArr);
const material2 = new THREE.LineBasicMaterial({
color: new THREE.Color('white'),
transparent: true,
opacity: 0.8 - i * 0.05
});
const line = new THREE.LineSegments(geometry2, material2);
line.rotateX(-Math.PI / 2);
line.position.y = -10;
scene.add(line);
}
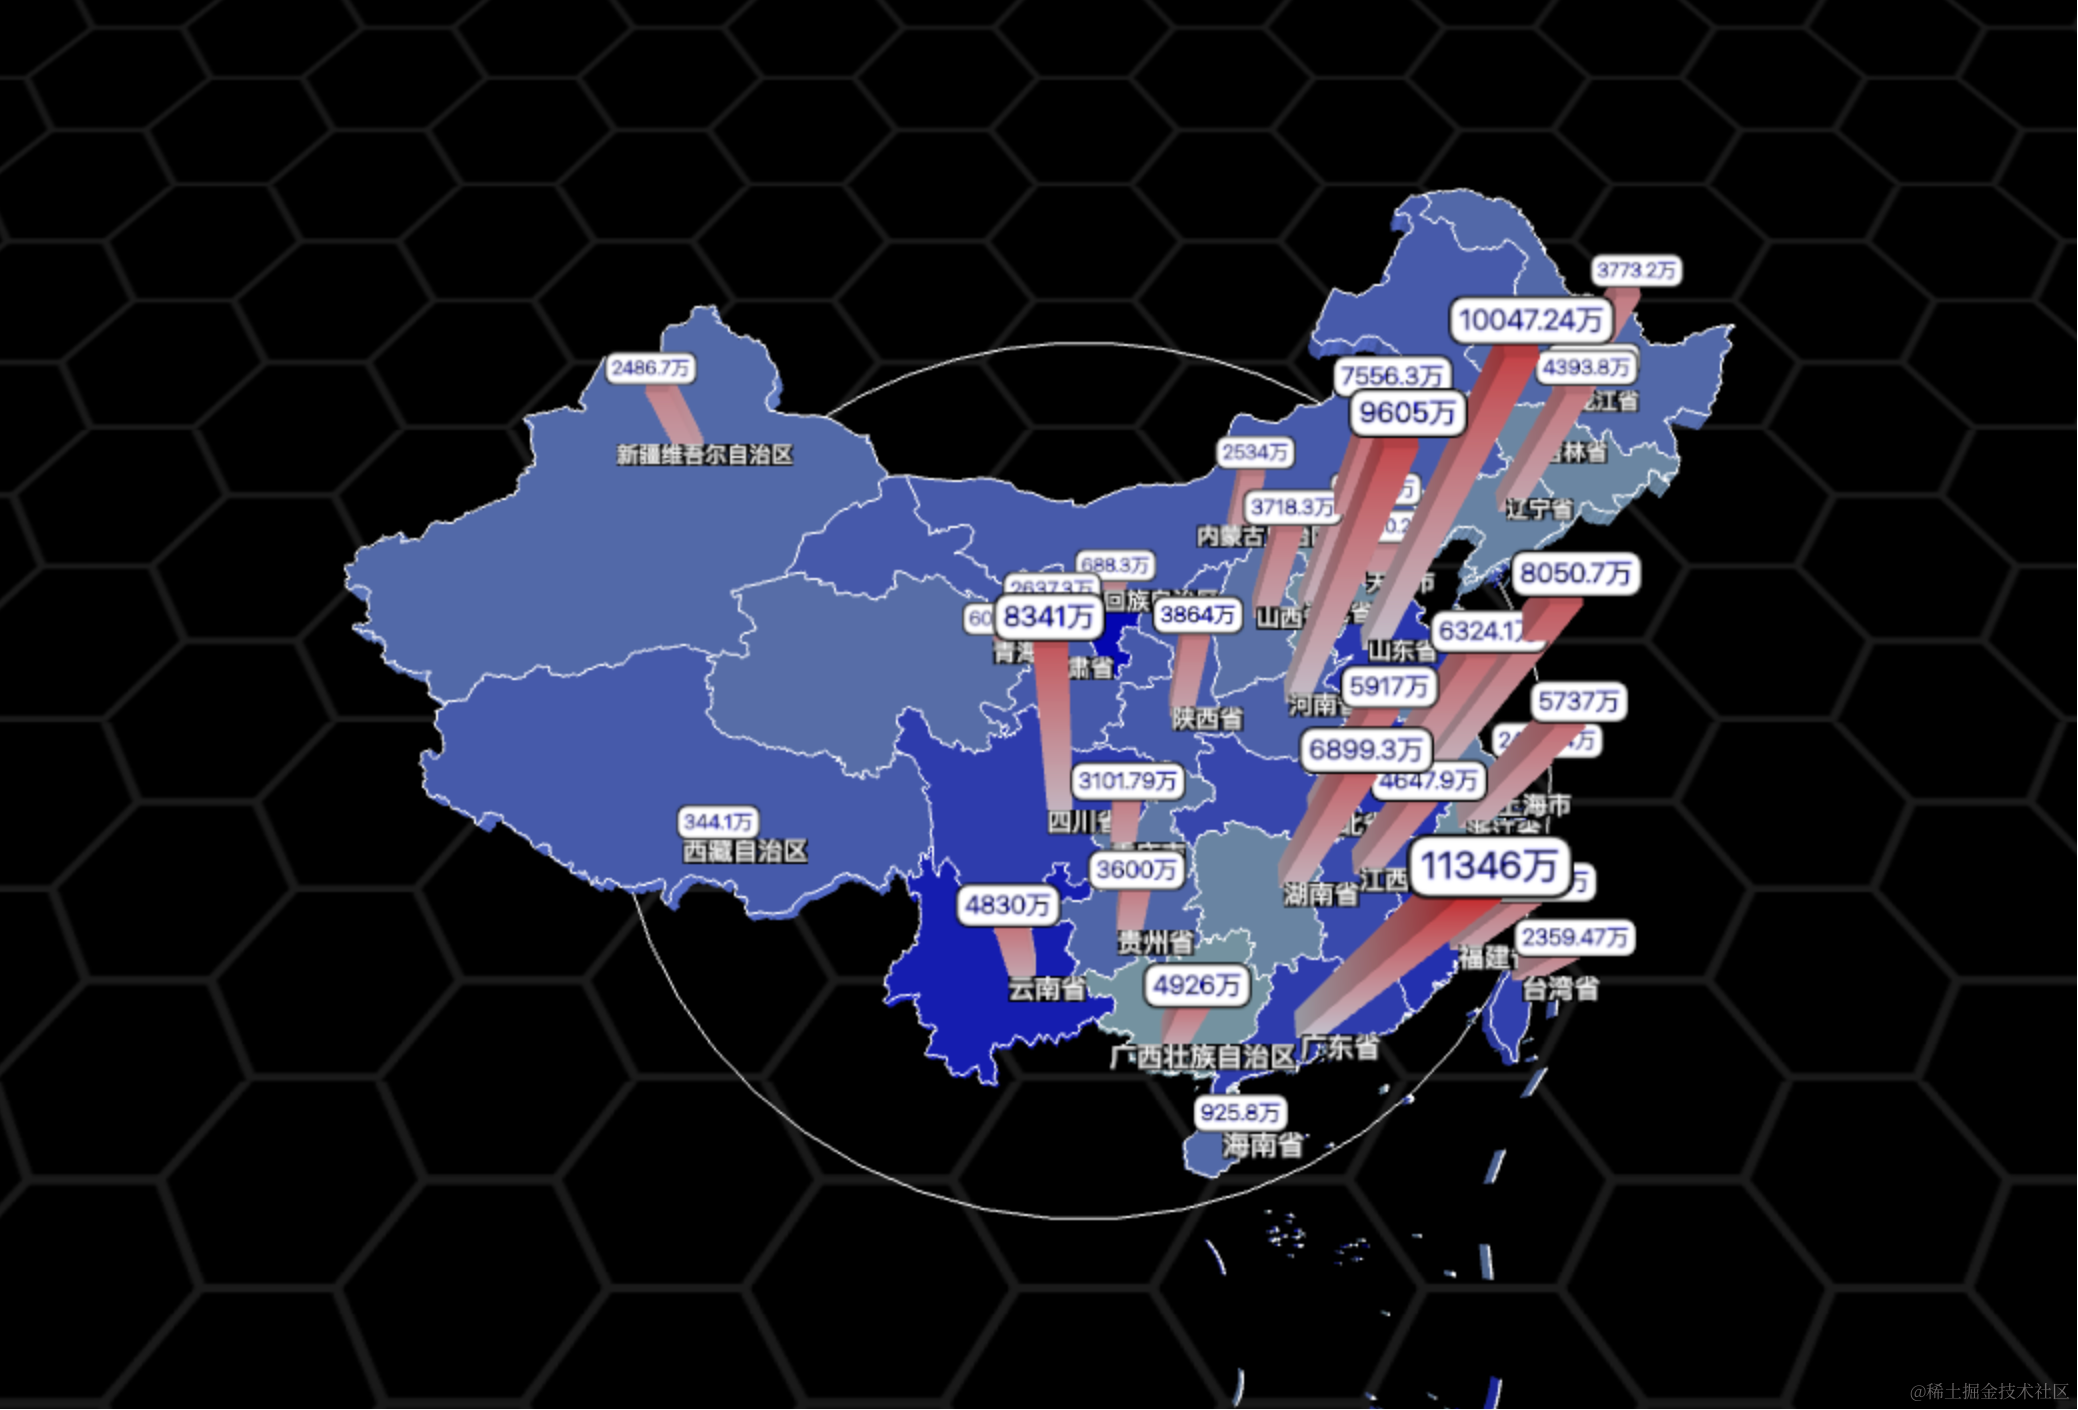
}看下效果:
这样就好看多了。
案例代码上传了小册仓库
总结
这节我们给地图加上了人口和省市名的标注,用 SpriteText 来展示文字。
然后用 gsap 做了出现时的动画。
然后我们加了一层 PlaneGeometry 画背景,并且用 Line、LineSegments 配合 BufferGeometry 来画了一圈圈的装饰线。
至此,我们的全国人口柱状图就完成了。