echarts 的柱状图可以设置多种颜色,根据不同的数值大小来显示不同的颜色,中间的数值颜色渐变:
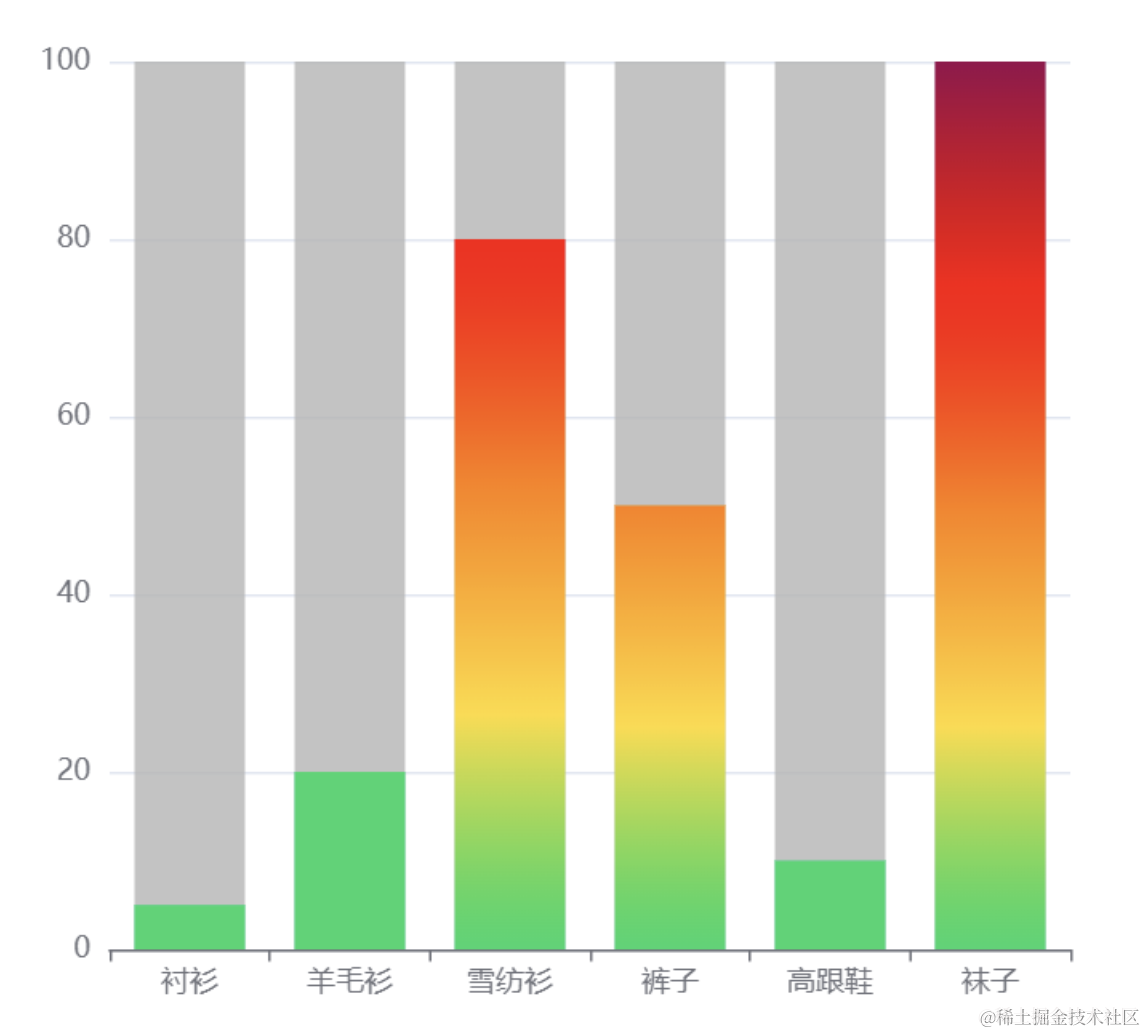
从颜色就可以直观看出数值大小。
我们学完自定义顶点颜色后,也可以实现这种效果。
我们就通过这个案例来练习一下:
npx create-vite gradient-color-bar-chart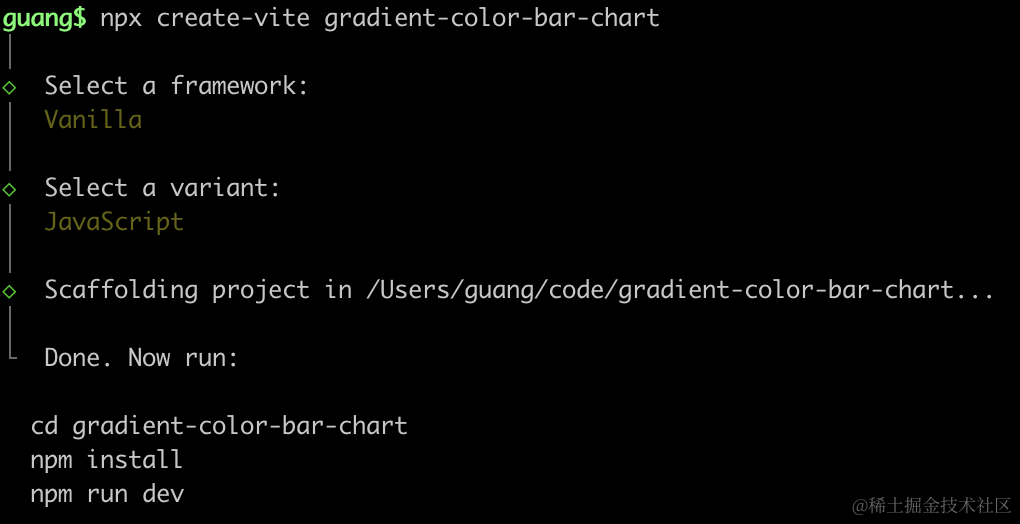
进入项目,安装依赖:
npm install
npm install --save three
npm install --save-dev @types/three
改下 src/main.js
import './style.css';
import * as THREE from 'three';
import {
    OrbitControls
} from 'three/addons/controls/OrbitControls.js';
import mesh from './mesh.js';

const scene = new THREE.Scene();
scene.add(mesh);

const directionLight = new THREE.DirectionalLight(0xffffff, 2);
directionLight.position.set(500, 400, 300);
scene.add(directionLight);

const ambientLight = new THREE.AmbientLight();
scene.add(ambientLight);

const width = window.innerWidth;
const height = window.innerHeight;

const helper = new THREE.AxesHelper(500);
// scene.add(helper);

const camera = new THREE.PerspectiveCamera(60, width / height, 0.1, 1000);
camera.position.set(30, 0, 240);
camera.lookAt(0, 0, 0);

const renderer = new THREE.WebGLRenderer();
renderer.setSize(width, height)

function render() {
    renderer.render(scene, camera);
    requestAnimationFrame(render);
}

render();

document.body.append(renderer.domElement);

const controls = new OrbitControls(camera, renderer.domElement);
创建 Scene、Light、Camera、Renderer。
改下 style.css
body {
margin: 0;
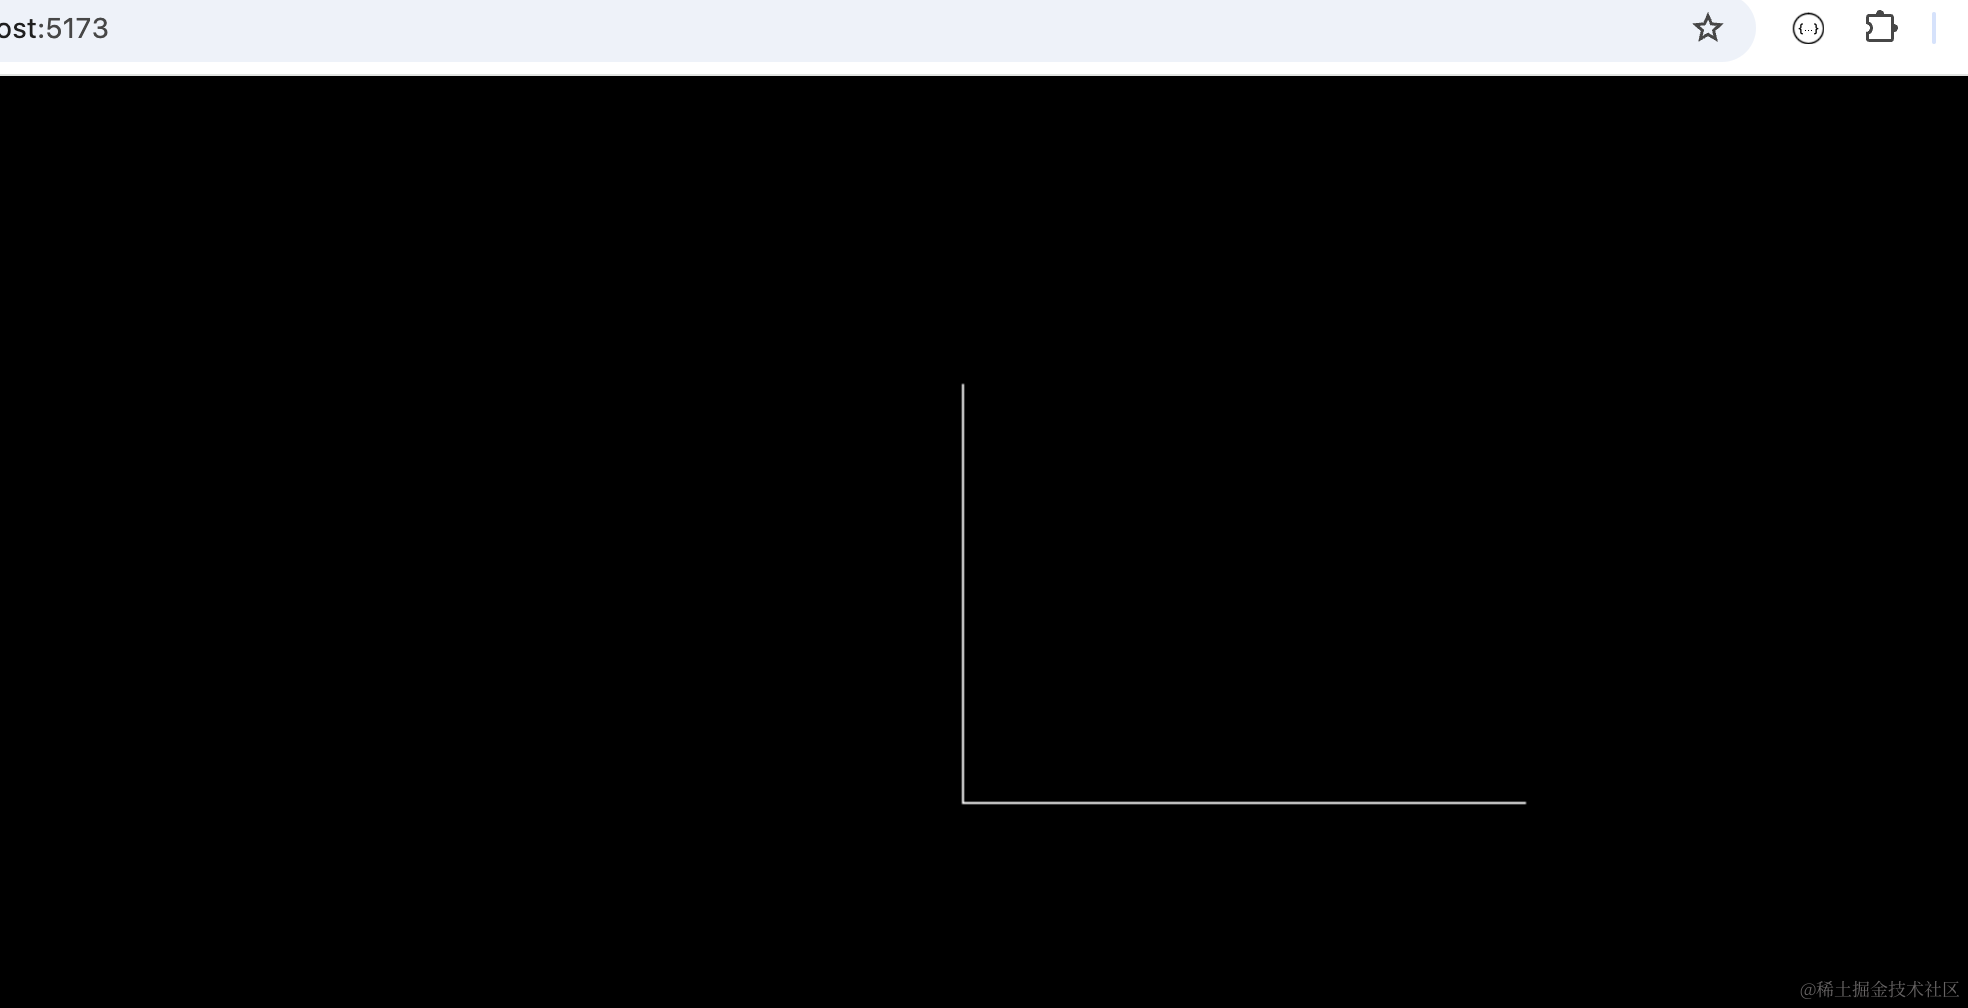
}首先画一下 x、y 轴:
mesh.js
import * as THREE from 'three';

const group = new THREE.Group();

function createLine(type) {
    const points = [
        new THREE.Vector3(0, 0, 0),
        type === 'y'
            ? new THREE.Vector3(0, 100, 0)
            : new THREE.Vector3(100, 0, 0)
    ]
    const geometry = new THREE.BufferGeometry();
    const material = new THREE.LineBasicMaterial({
        color: '#ffffff'
    });
    geometry.setFromPoints(points);

    const line = new THREE.Line(geometry, material);
    return line;
}

const xLine = createLine('x');
const yLine = createLine('y');
group.add(xLine, yLine);

export default group;
用 Line 画 2 条线,几何体用 BufferGeometry 通过 setFromPoints 来确定顶点数据
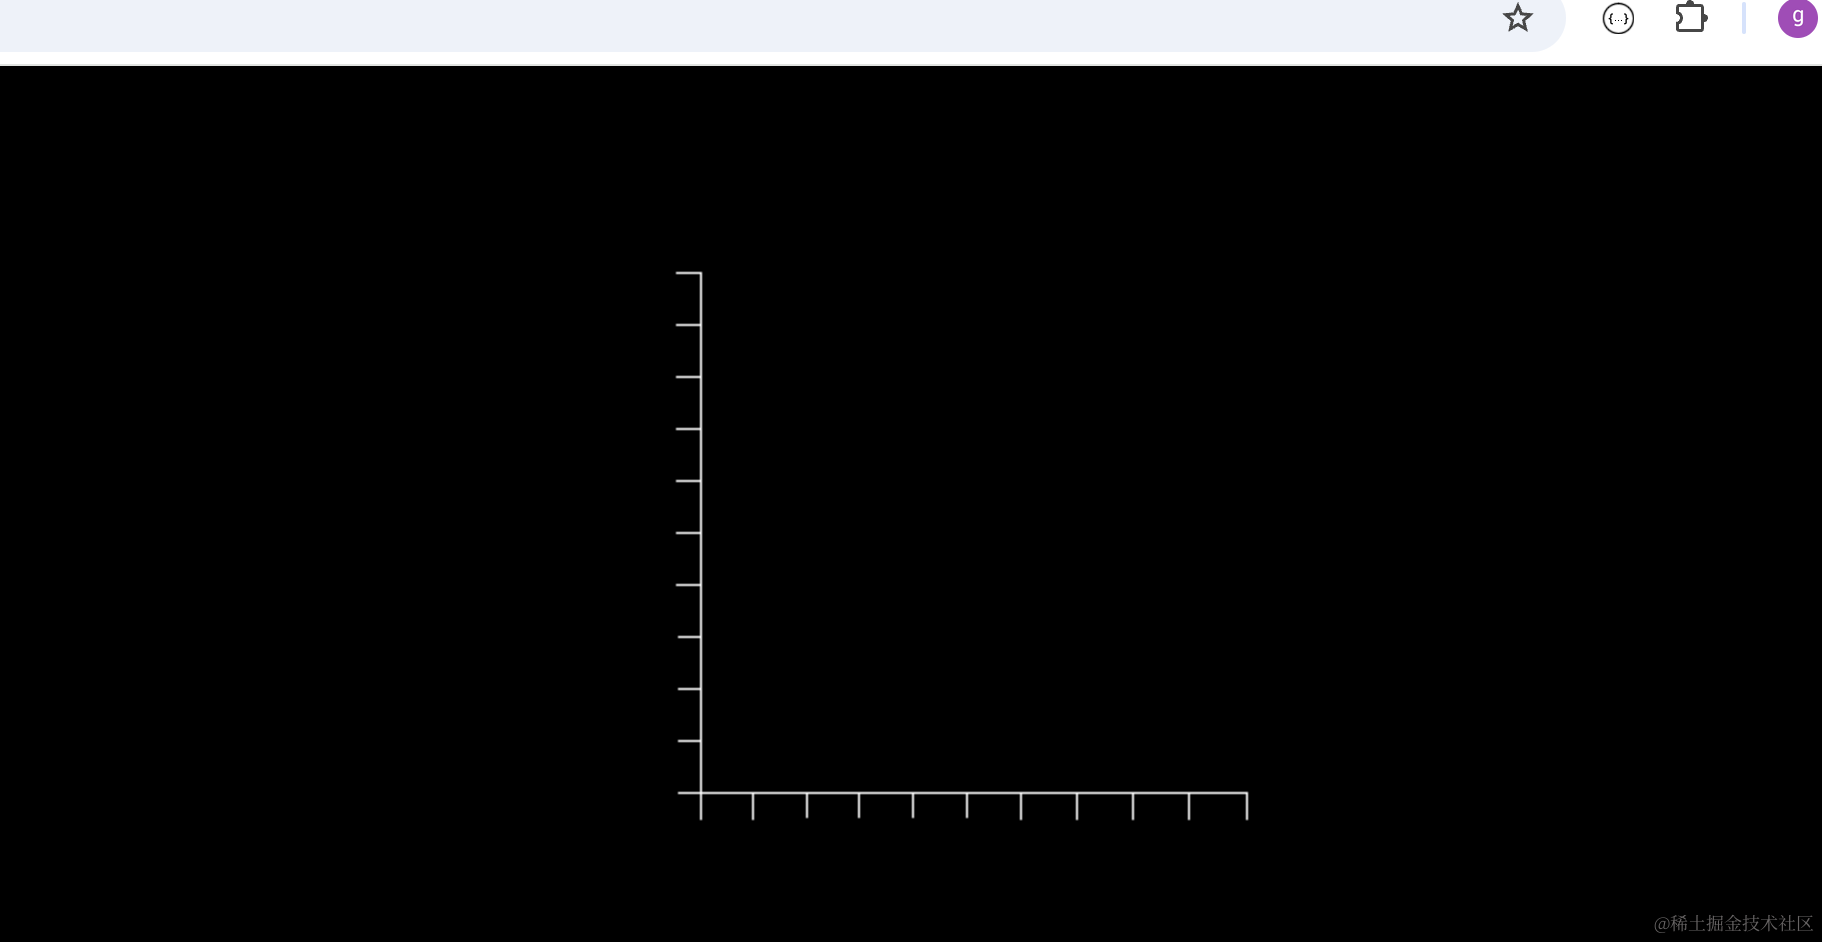
跑下:
npm run dev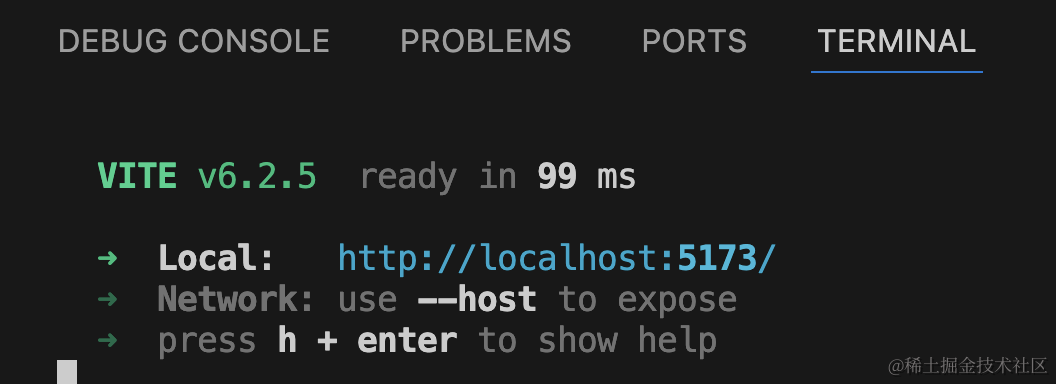
然后画一下刻度:
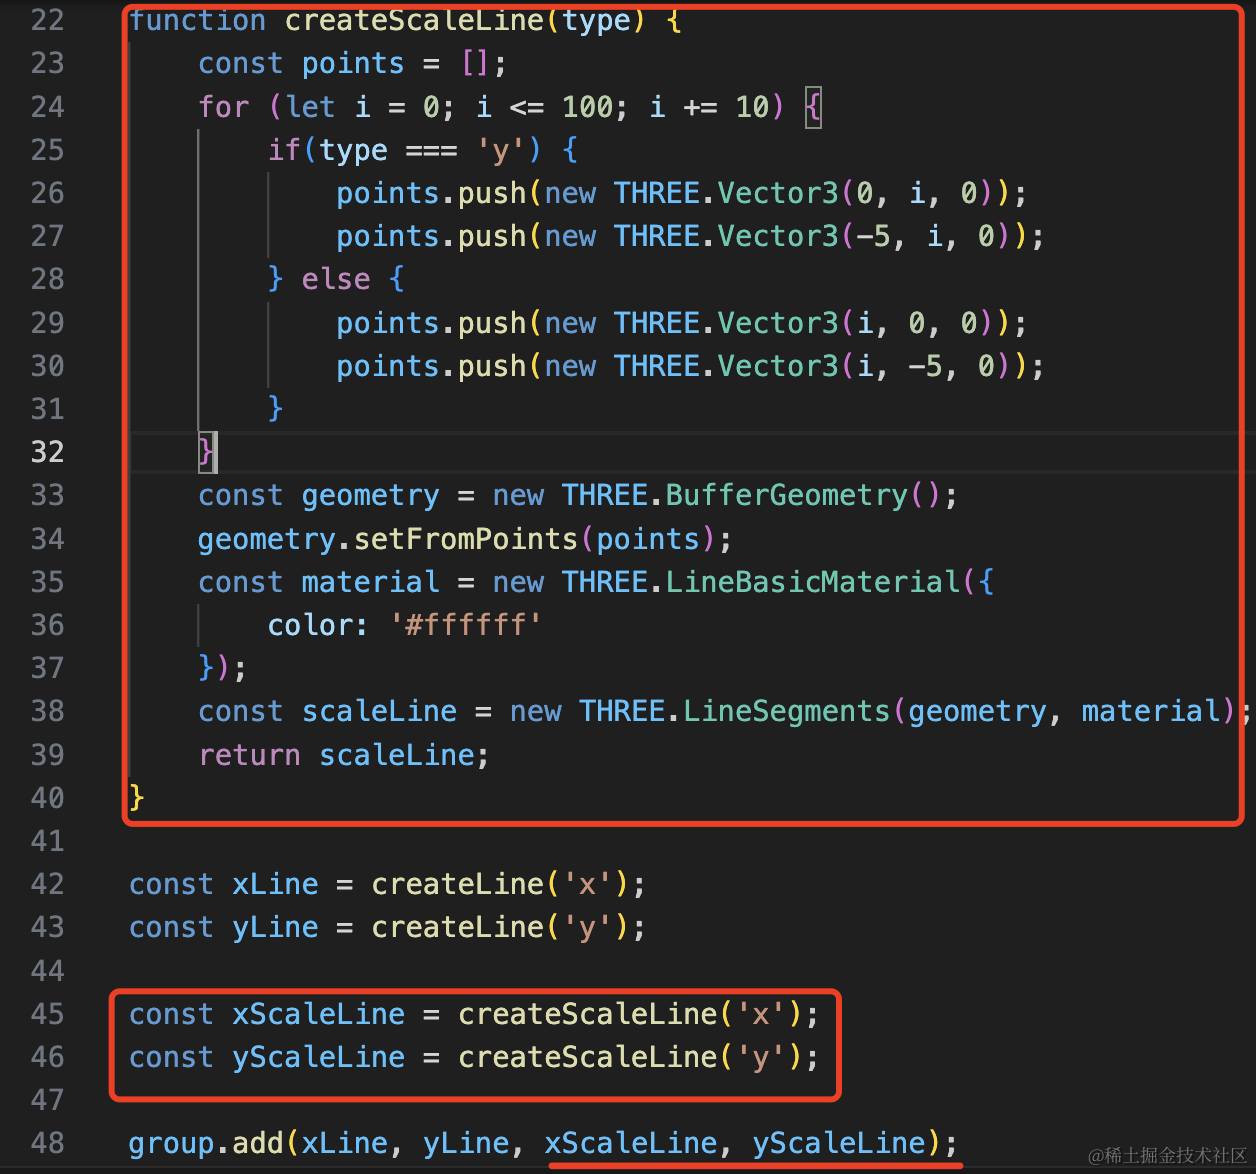
每两个点构成一条线段,用 LineSegments 画出来:
function createScaleLine(type) {
    const points = [];
    for (let i = 0; i <= 100; i += 10) {
        if(type === 'y') {
            points.push(new THREE.Vector3(0, i, 0));
            points.push(new THREE.Vector3(-5, i, 0));
        } else {
            points.push(new THREE.Vector3(i, 0, 0));
            points.push(new THREE.Vector3(i, -5, 0));
        }
    }
    const geometry = new THREE.BufferGeometry();
    geometry.setFromPoints(points);
    const material = new THREE.LineBasicMaterial({
        color: '#ffffff'
    });
    const scaleLine = new THREE.LineSegments(geometry, material);
    return scaleLine;
}

const xLine = createLine('x');
const yLine = createLine('y');

const xScaleLine = createScaleLine('x');
const yScaleLine = createScaleLine('y');

group.add(xLine, yLine, xScaleLine, yScaleLine);
然后来画柱状图,这里用 PlaneGeometry 就行:
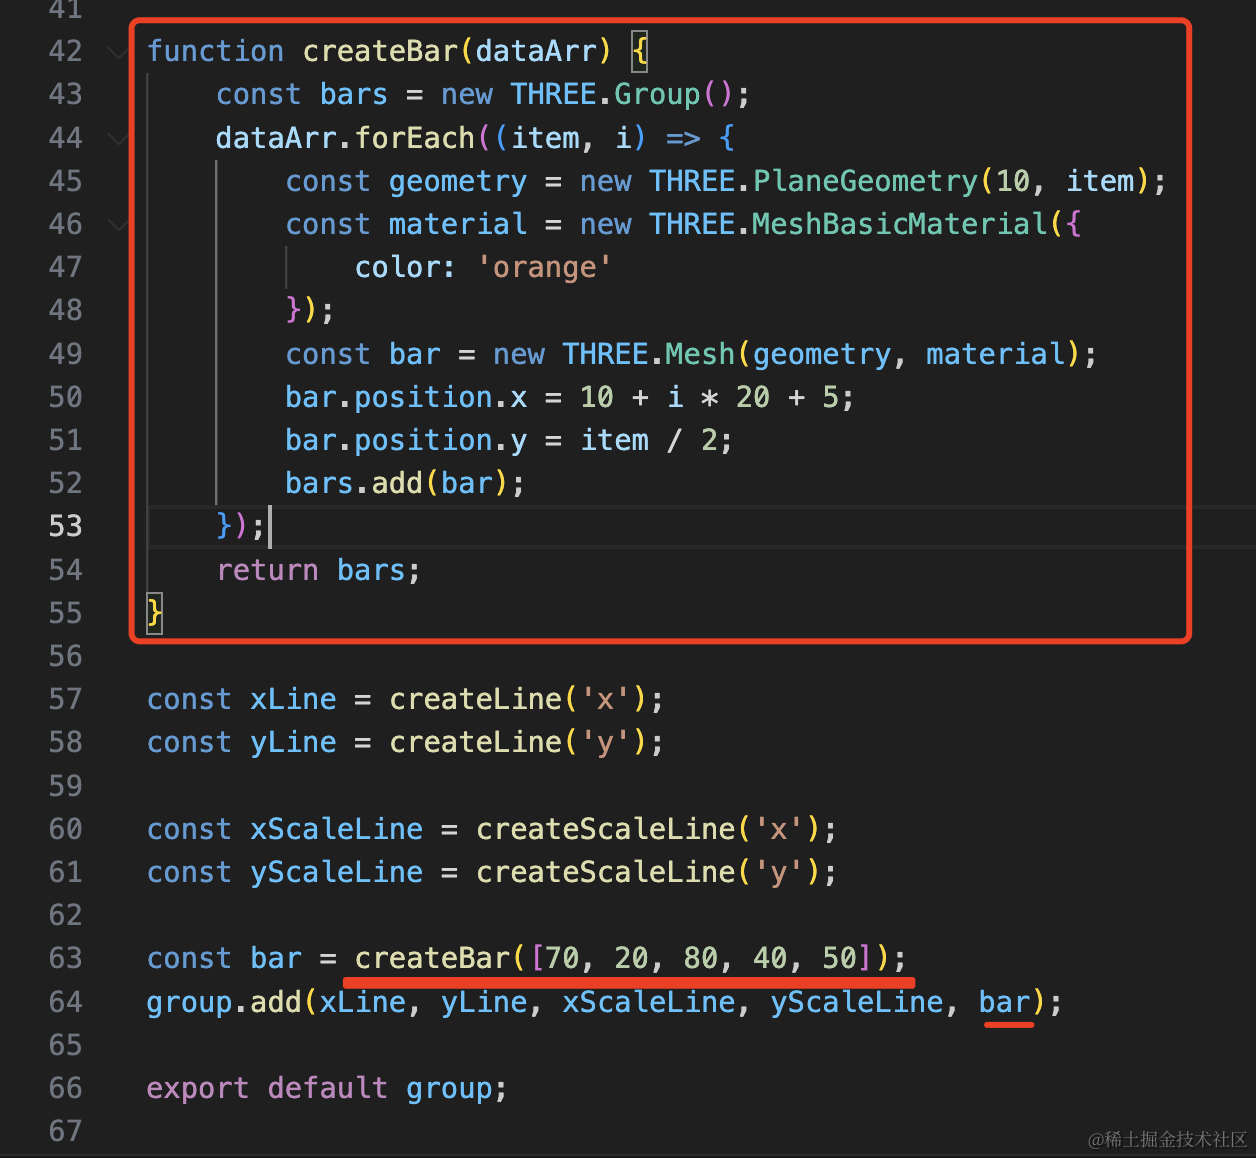
传入数组,根据高度创建平面,这里调整每个 bar 的 y 就是高度的一半,x 是留出刚开始的 10,然后每 20 宽度放一个,还要加上宽度的一半也就是 5
function createBar(dataArr) {
    const bars = new THREE.Group();
    dataArr.forEach((item, i) => {
        const geometry = new THREE.PlaneGeometry(10, item);
        const material = new THREE.MeshBasicMaterial({
            color: 'orange'
        });
        const bar = new THREE.Mesh(geometry, material);
        bar.position.x = 10 + i * 20 + 5;
        bar.position.y = item / 2;
        bars.add(bar);
    });
    return bars;
}
const bar = createBar([70, 20, 80, 40, 50]);
group.add(xLine, yLine, xScaleLine, yScaleLine, bar);看下效果:
这样,柱状图就画好了。
然后加上颜色渐变,这里要根据高度来自定义 geometry.attributes.color
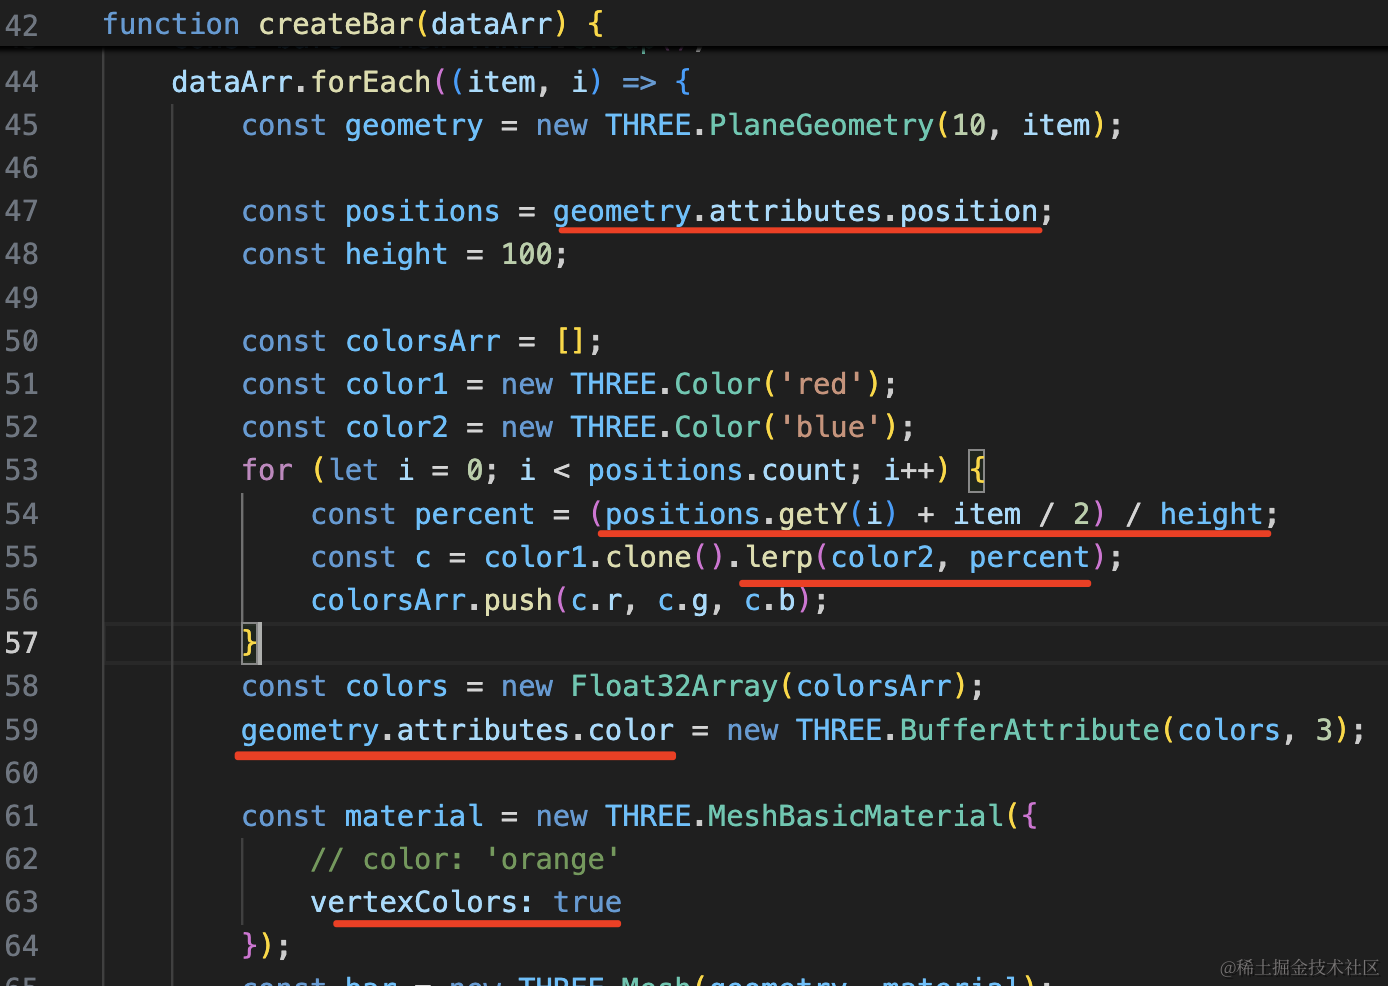
拿到所有的顶点,根据 y 值和高度的比值算出颜色百分比,用 color.lerp 来计算颜色。
这里 y 要加上高度的一半,也就是下边和 x 轴平齐的位置再算
最后把算出的顶点颜色设置到 geometry.attributes.color
要在 material 设置 vertexColors 为 true,使用顶点颜色。
const positions = geometry.attributes.position;
const height = 100;

const colorsArr = [];
const color1 = new THREE.Color('red');
const color2 = new THREE.Color('blue');
for (let i = 0; i < positions.count; i++) {
    const percent = (positions.getY(i) + item / 2) / height;
    const c = color1.clone().lerp(color2, percent);
    colorsArr.push(c.r, c.g, c.b);
}
const colors = new Float32Array(colorsArr);
geometry.attributes.color = new THREE.BufferAttribute(colors, 3);

const material = new THREE.MeshBasicMaterial({
    // color: 'orange'
    vertexColors: true
});
看下效果:
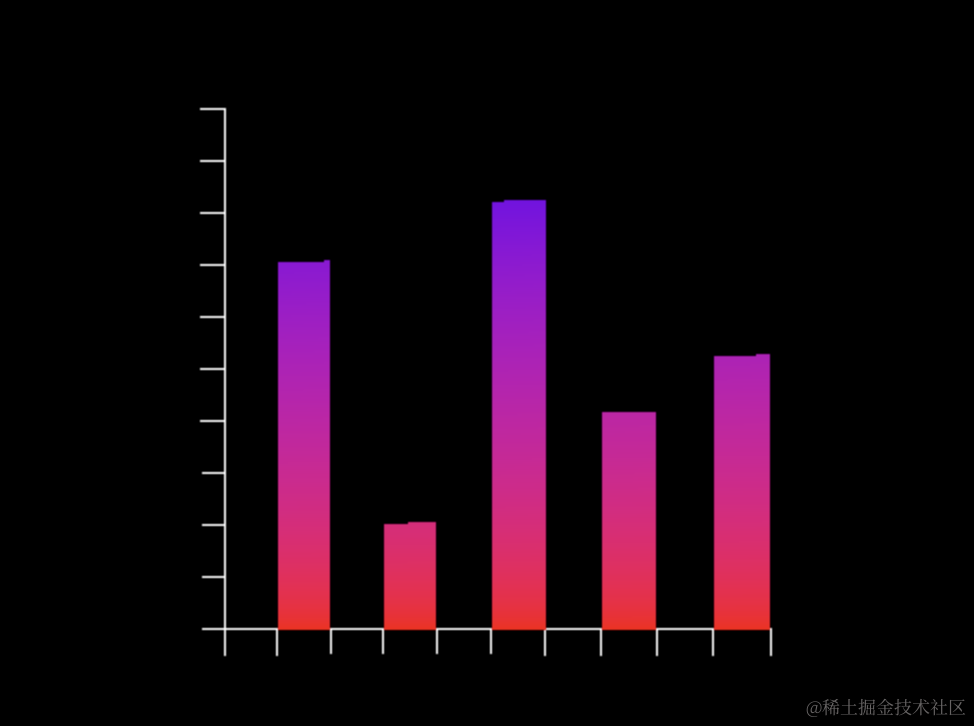
可以看到,现在不同高度就显示不同的颜色了。
但只是一种颜色的渐变比较单调,如何实现多种颜色渐变呢?
比如这样:
也一样的,分段计算颜色即可,每段和之前一样计算百分比
比如我们分 2 段:
先在高度方向设置分段数多一点:
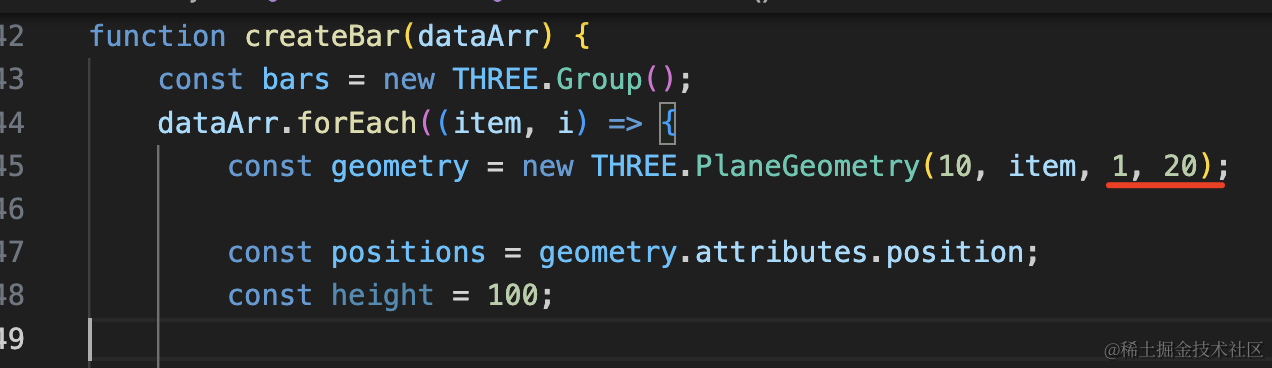
不然都没那么多顶点让你去设置颜色。
然后分 0-50、50-100 分别计算就可以了:
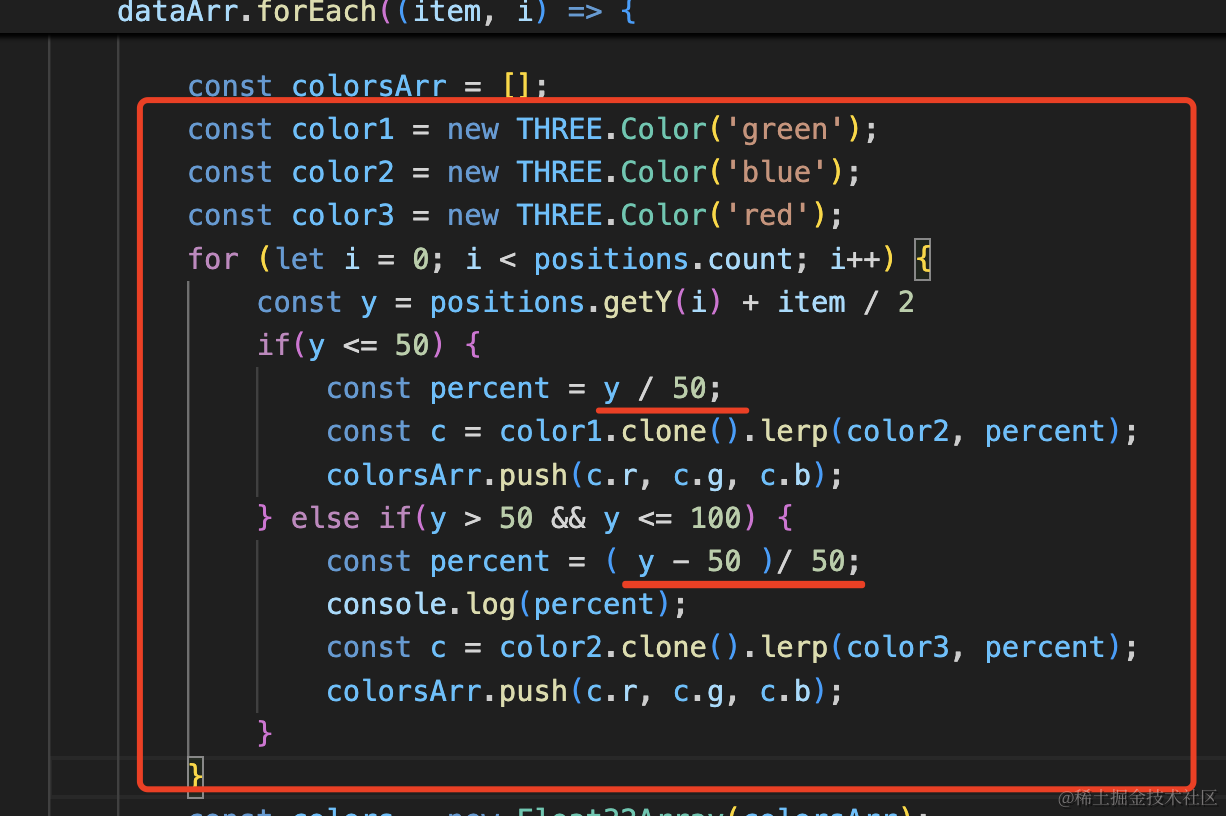
0-50 就是 num / 50 算百分比,50-100 就是减去 50 再除以 50 算百分比。
const color1 = new THREE.Color('green');
const color2 = new THREE.Color('blue');
const color3 = new THREE.Color('red');
for (let i = 0; i < positions.count; i++) {
const y = positions.getY(i) + item / 2
if(y <= 50) {
const percent = y / 50;
const c = color1.clone().lerp(color2, percent);
colorsArr.push(c.r, c.g, c.b);
} else if(y > 50 && y <= 100) {
const percent = ( y - 50 )/ 50;
console.log(percent);
const c = color2.clone().lerp(color3, percent);
colorsArr.push(c.r, c.g, c.b);
}
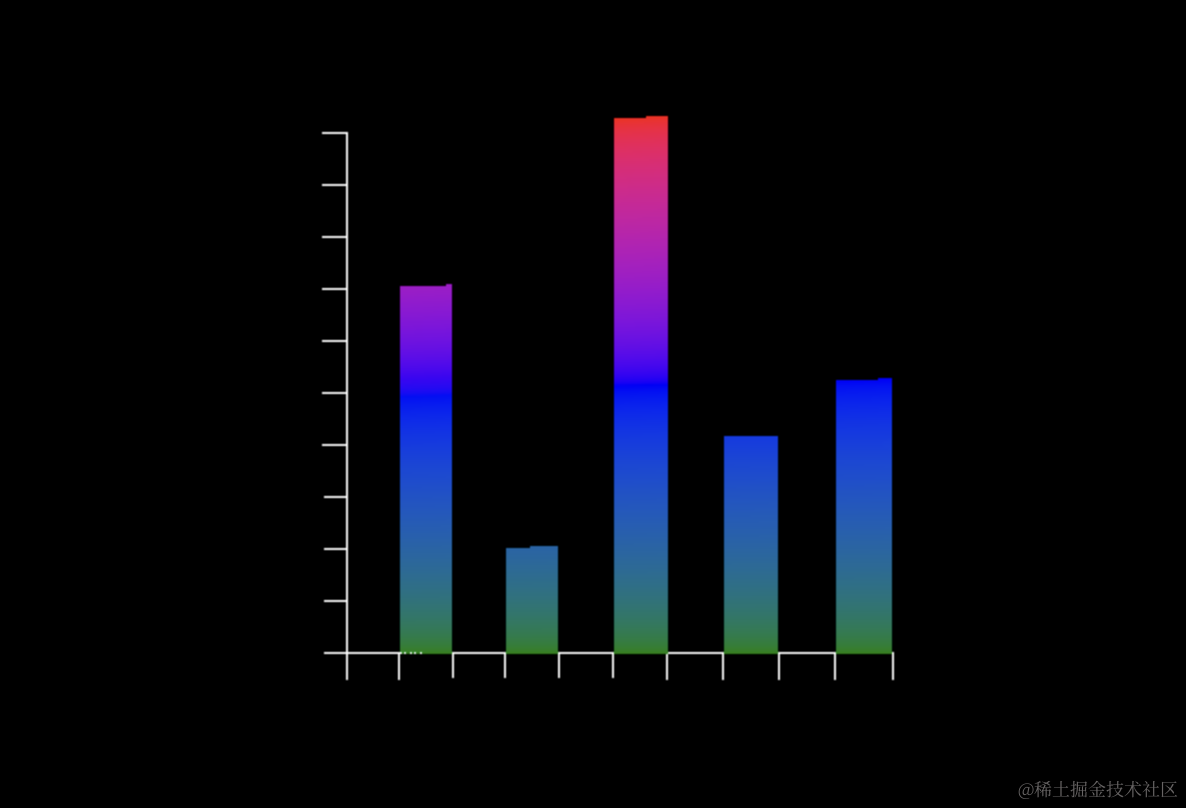
}我加了一个 100 的数值:
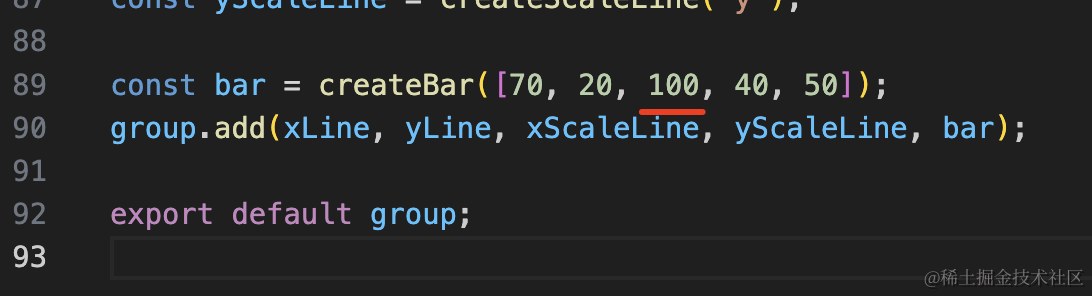
这样可以明显看出来是三种颜色的渐变:
最后我们可以给它加上数字,这个也是 PlaneGeometry 来做,用 canvas 画数字:
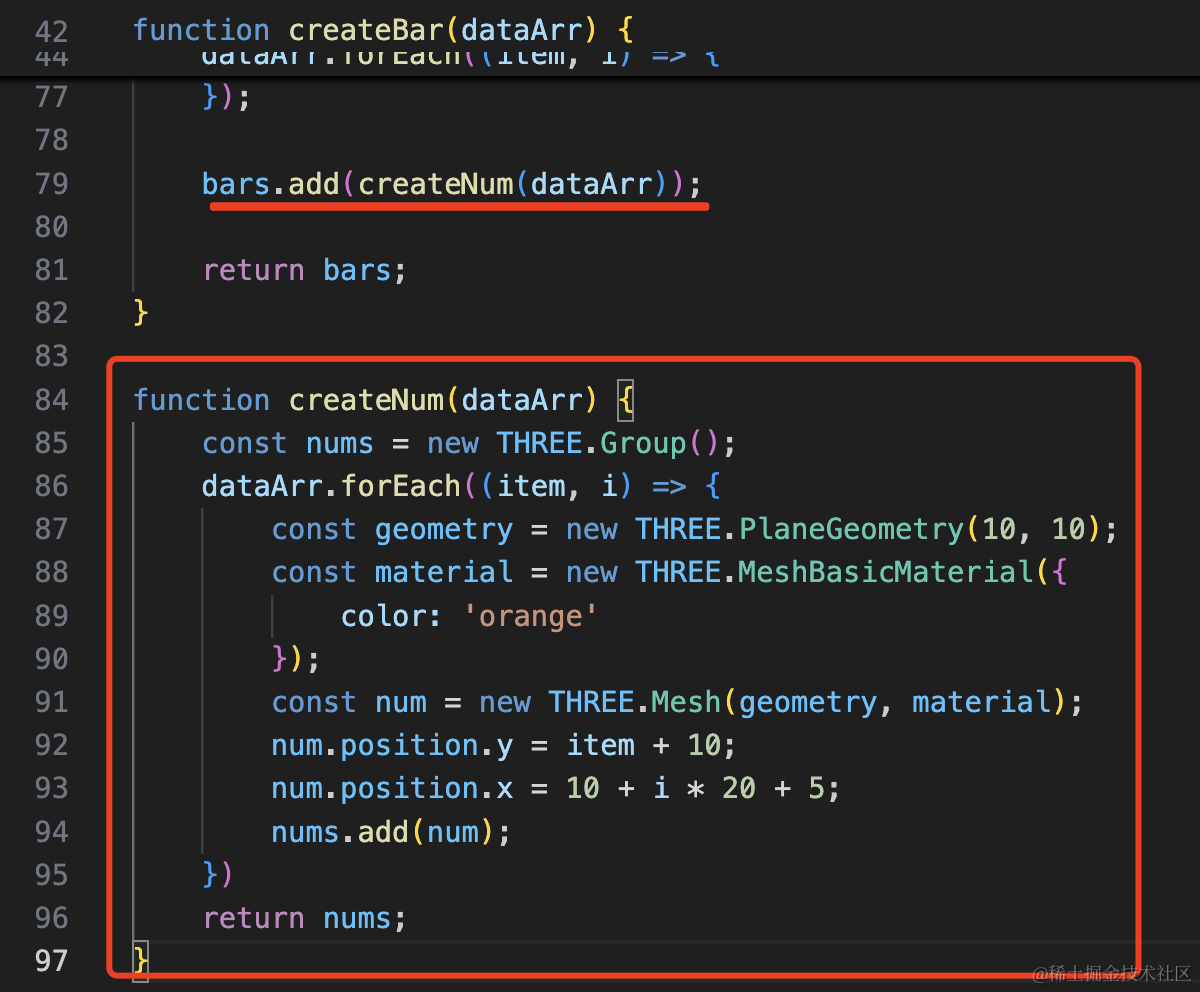
bars.add(createNum(dataArr));function createNum(dataArr) {
const nums = new THREE.Group();
dataArr.forEach((item, i) => {
const geometry = new THREE.PlaneGeometry(10, 10);
const material = new THREE.MeshBasicMaterial({
color: 'orange'
});
const num = new THREE.Mesh(geometry, material);
num.position.y = item + 10;
num.position.x = 10 + i * 20 + 5;
nums.add(num);
})
return nums;
}
在上面加一个矩形平面,位置的设置和 bar 一样,只不过 y 多了 10

然后用 canvas 来画数字:
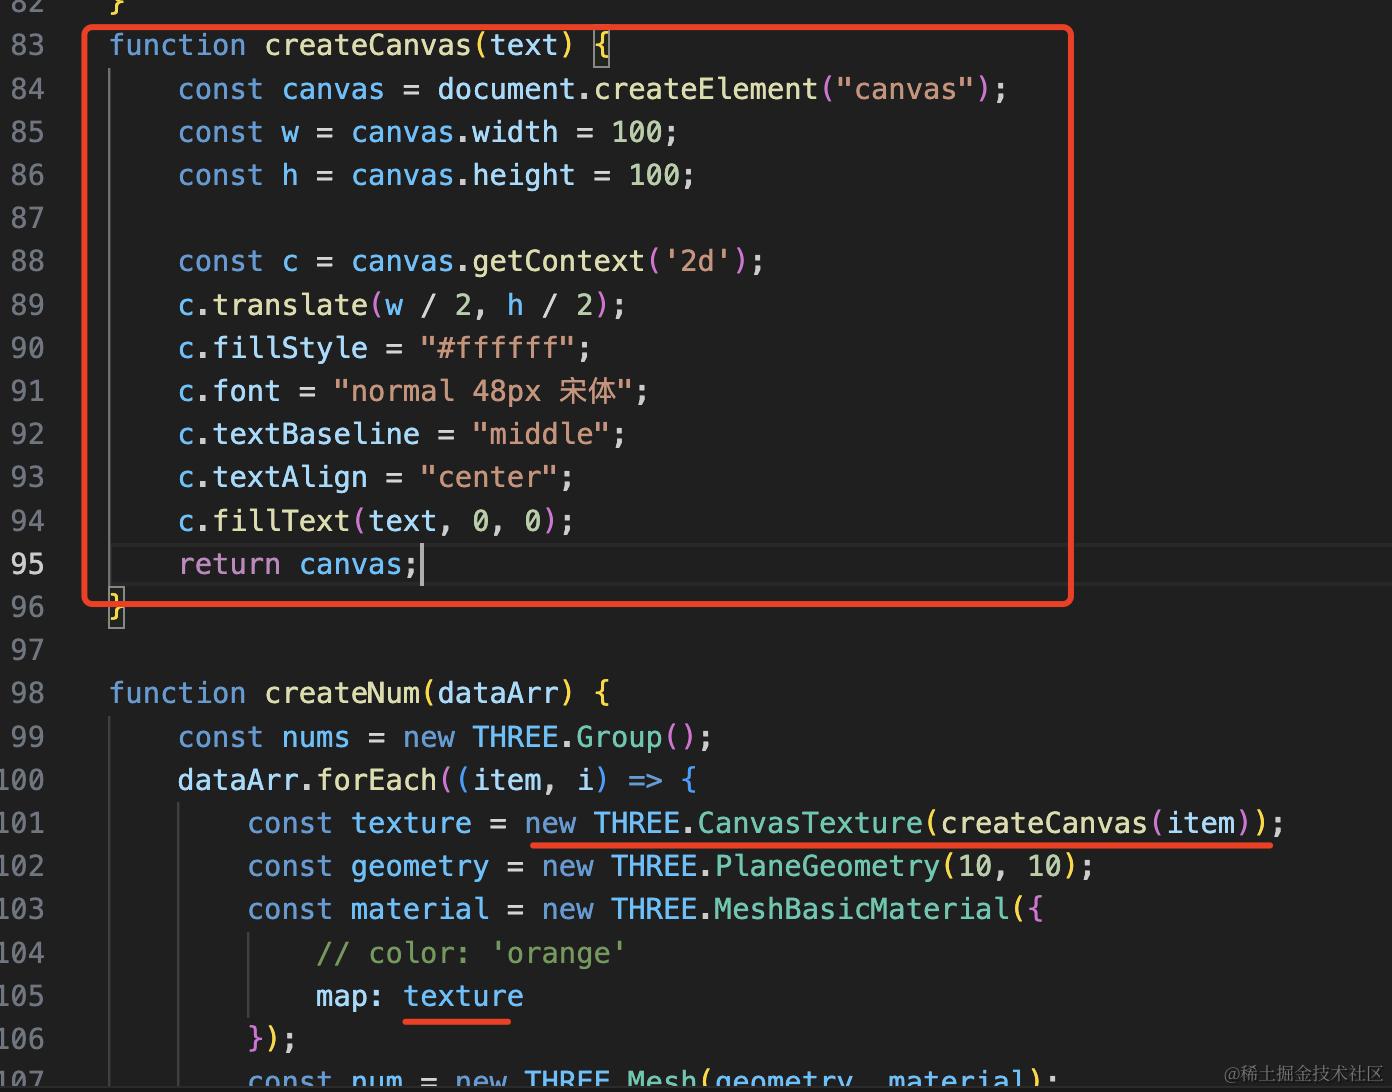
function createCanvas(text) {
    const canvas = document.createElement("canvas");
    const w = canvas.width = 100;
    const h = canvas.height = 100;

    const c = canvas.getContext('2d');
    c.translate(w / 2, h / 2);
    c.fillStyle = "#ffffff";
    c.font = "normal 48px 宋体";
    c.textBaseline = "middle";
    c.textAlign = "center";
    c.fillText(text, 0, 0);
    return canvas;
}
const texture = new THREE.CanvasTexture(createCanvas(item));
const geometry = new THREE.PlaneGeometry(10, 10);
const material = new THREE.MeshBasicMaterial({
// color: 'orange'
map: texture
});画布宽高 100 * 100,字体大小 48,把坐标原点移到画布中心,然后写个数字
用 CanvasTexture 创建纹理,作为矩形平面的颜色贴图
看下效果:

这样,颜色渐变柱状图就完成了。
虽然我们使用矩形平面画的,你也可以用立方体来画,效果一样。
此外,你可能会发现它有很多锯齿:
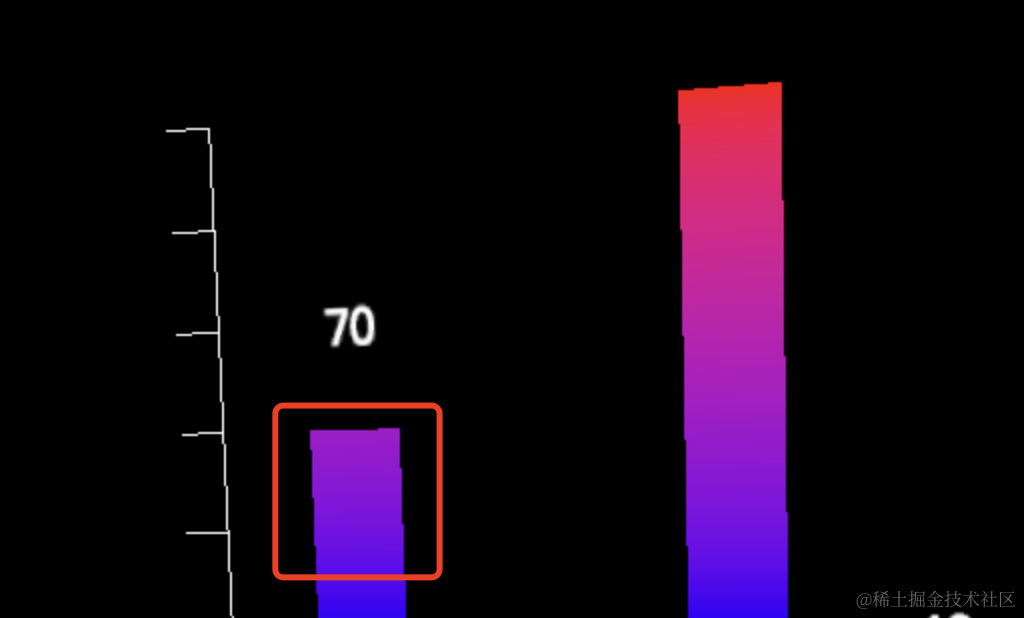
开一下抗锯齿就好了:
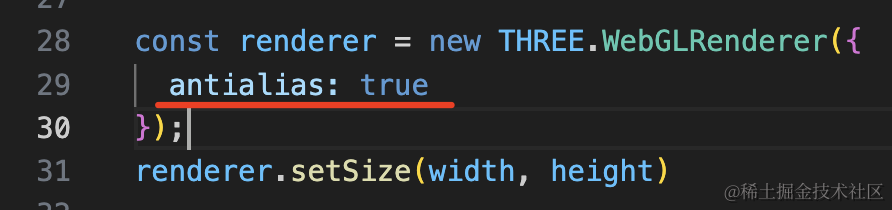
const renderer = new THREE.WebGLRenderer({
  antialias: true
});
案例代码上传了小册仓库。
总结
这节我们用自定义顶点颜色实现了颜色渐变柱状图。
根据 y 和高度的比值计算百分比,用 color.lerp 计算差值颜色,设置到 geometry.attributes.color
多种颜色渐变也是一样,分多段计算颜色最后合并就好了。
上面的数字用矩形平面 + CanvasTexture 来画。
自定义顶点颜色在特定场景下计算渐变色是非常有用的。