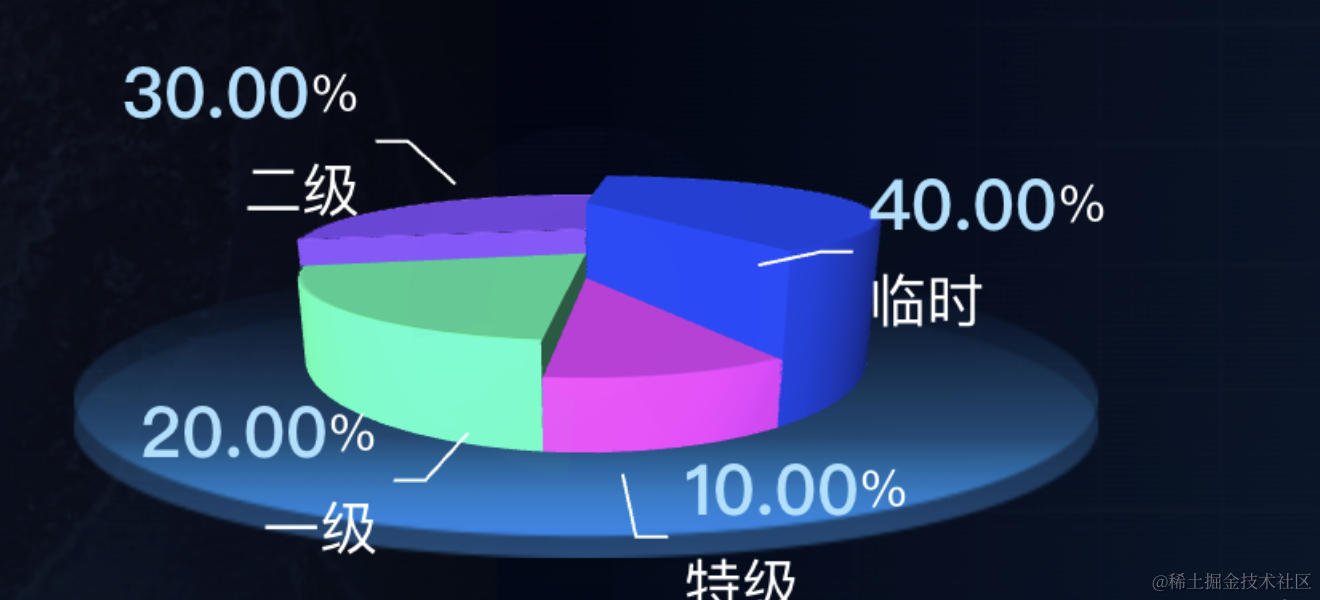
这节我们来实现一个 3D 饼图的效果。
类似这样:
首先来分析下思路:
饼图的每个部分可以先用曲线 Curve 画出来,然后用 ExtrudeGeometry 来拉伸成几何体。
具体的曲线是一条圆弧曲线 EllipseCurve,搭配两条 LineCurve 直线,用 CurvePath 连接起来。
类似这样:
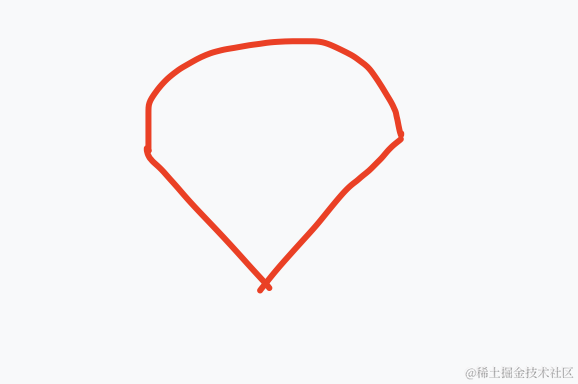
然后拉伸一下就好了。
点击每个部分用 RayCaster 实现,点击的时候让那个部分来做位移。
具体怎么移动呢?
这个与角度有关系,拿到角度之后通过 cos、sin 算出来移动到的目标位置,用 tweenjs 来做动画。
上面的数字用 canvas 画好,然后设置到 Sprite 的颜色贴图就好了。
这就是 3D 饼图的实现思路。
下面我们来写一下:
npx create-vite 3d-pie-chart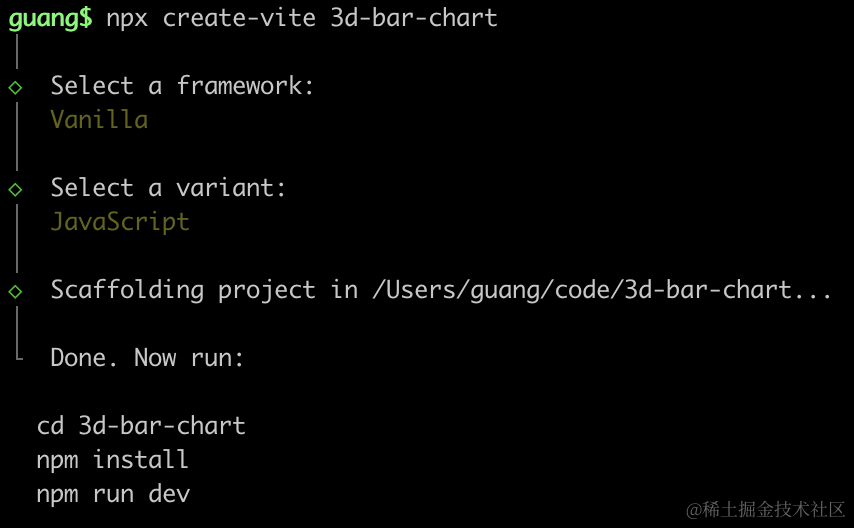 进入项目,安装依赖:
npm install
npm install --save three
npm install --save-dev @types/three
改下 src/main.js
import './style.css';
import * as THREE from 'three';
import {
    OrbitControls
} from 'three/addons/controls/OrbitControls.js';
import mesh from './mesh.js';

const scene = new THREE.Scene();
scene.add(mesh);

const directionLight = new THREE.DirectionalLight(0xffffff, 2);
directionLight.position.set(500, 400, 300);
scene.add(directionLight);

const ambientLight = new THREE.AmbientLight();
scene.add(ambientLight);

const width = window.innerWidth;
const height = window.innerHeight;

const helper = new THREE.AxesHelper(1000);
// scene.add(helper);

const camera = new THREE.PerspectiveCamera(60, width / height, 0.1, 10000);
camera.position.set(500, 600, 800);
camera.lookAt(0, 0, 0);

const renderer = new THREE.WebGLRenderer();
renderer.setSize(width, height)

function render() {
    renderer.render(scene, camera);
    requestAnimationFrame(render);
}

render();

document.body.append(renderer.domElement);

const controls = new OrbitControls(camera, renderer.domElement);
创建 Scene、Light、Camera、Renderer。
改下 style.css
body {
  margin: 0;
}
写下 src/mesh.js
import * as THREE from 'three';
import { LineMaterial } from 'three/examples/jsm/Addons.js';

const curvePath = new THREE.CurvePath();

const v1 = new THREE.Vector2(0, 0);
const v2 = new THREE.Vector2(0, 300);
const v3 = new THREE.Vector2(300, 0);

const line1 = new THREE.LineCurve(v1, v3);
curvePath.add(line1);

const arc = new THREE.EllipseCurve(0, 0, 300, 300, 0, Math.PI / 2);
curvePath.add(arc);

const line2 = new THREE.LineCurve(v1, v2);
curvePath.add(line2);

const points = curvePath.getPoints(100);
const shape = new THREE.Shape(points);

const geometry = new THREE.ExtrudeGeometry(shape, {
    depth: 100
})
const material = new THREE.MeshPhongMaterial({
    color: 'orange'
});

const mesh = new THREE.Mesh(geometry, material);

export default mesh;
就像前面分析的,我们先画了 1 条直线 LineCurve,然后画了一条曲线 EllipseCurve,之后再画一条直线,用 CurvePath 连接起来(顺序很重要)。
之后从上面取 100 个点来生成 Shape。
用这个 Shape 经过 ExtrudeGeometry 拉伸,形成几何体,创建网格模型。
看下效果:
npm run dev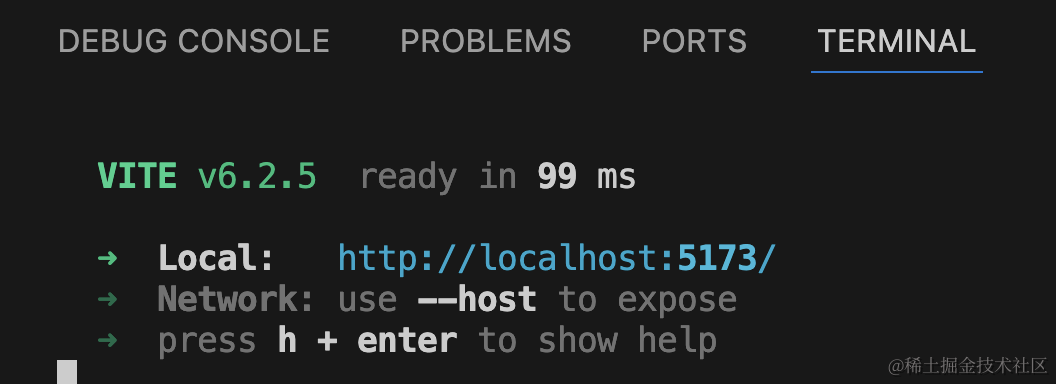
这样,饼图的一个部分就完成了。
然后我们指定数据,根据数据来画:
比如数据是这样的:
const data = [
    {
        name: '春节销售额',
        value: 1000
    },
    {
        name: '夏节销售额',
        value: 3000
    },
    {
        name: '秋节销售额',
        value: 800
    },
    {
        name: '冬节销售额',
        value: 500
    }
];
首先我们写下基础代码:
import * as THREE from 'three';

const group = new THREE.Group();

const R = 300;
function createPieChart(data) {
    let total = 0;
    data.forEach(item => {
        total += item.value;
    });

    const angles = data.map(item => {
        return item.value / total * 360;
    });
    console.log(angles);
}

const data = [
    {
        name: '春节销售额',
        value: 1000
    },
    {
        name: '夏节销售额',
        value: 3000
    },
    {
        name: '秋节销售额',
        value: 800
    },
    {
        name: '冬节销售额',
        value: 500
    }
];
createPieChart(data);

export default group;
createPieChart 方法里根据传入的数据计算出总数 total,然后计算出每个 part 的角度。
打印看下角度:
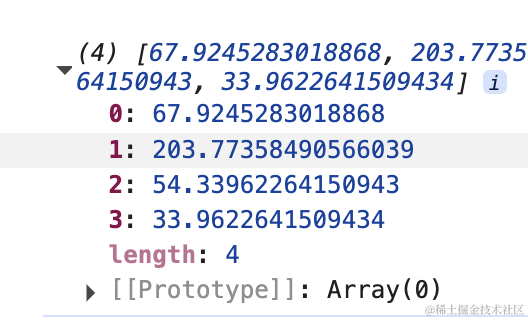
加起来正好 360
然后继续根据这个角度来画饼图的每个部分:
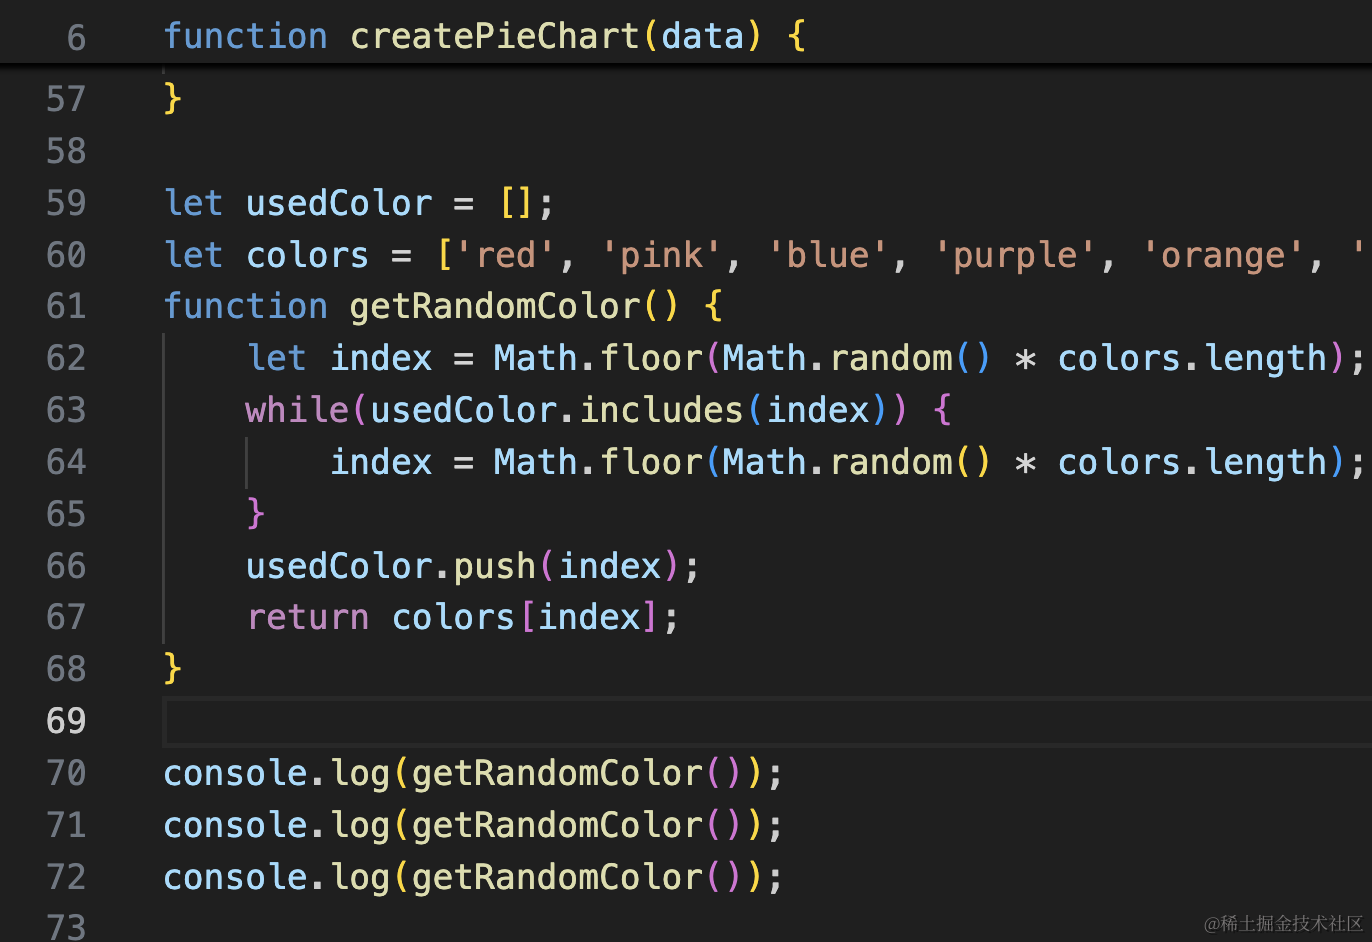
先来写一个生成随机颜色的函数:
let usedColor = [];
let colors = ['red', 'pink', 'blue', 'purple', 'orange', 'lightblue', 'green', 'lightgreen']
function getRandomColor() {
    let index = Math.floor(Math.random() * colors.length);
    while(usedColor.includes(index)) {
        index = Math.floor(Math.random() * colors.length);
    }
    usedColor.push(index);
    return colors[index];
}
就是从 colors 数组里随机取一个下标的颜色返回,用过的颜色记录下来,如果随机到用过的就重新生成。
试下效果:
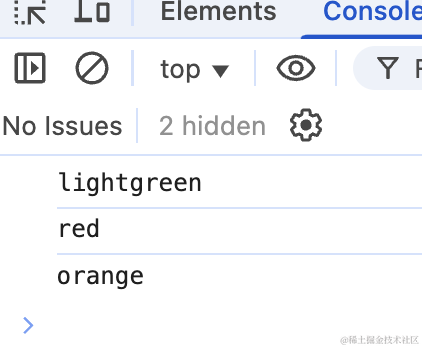
没啥问题。
然后就行来画饼图:
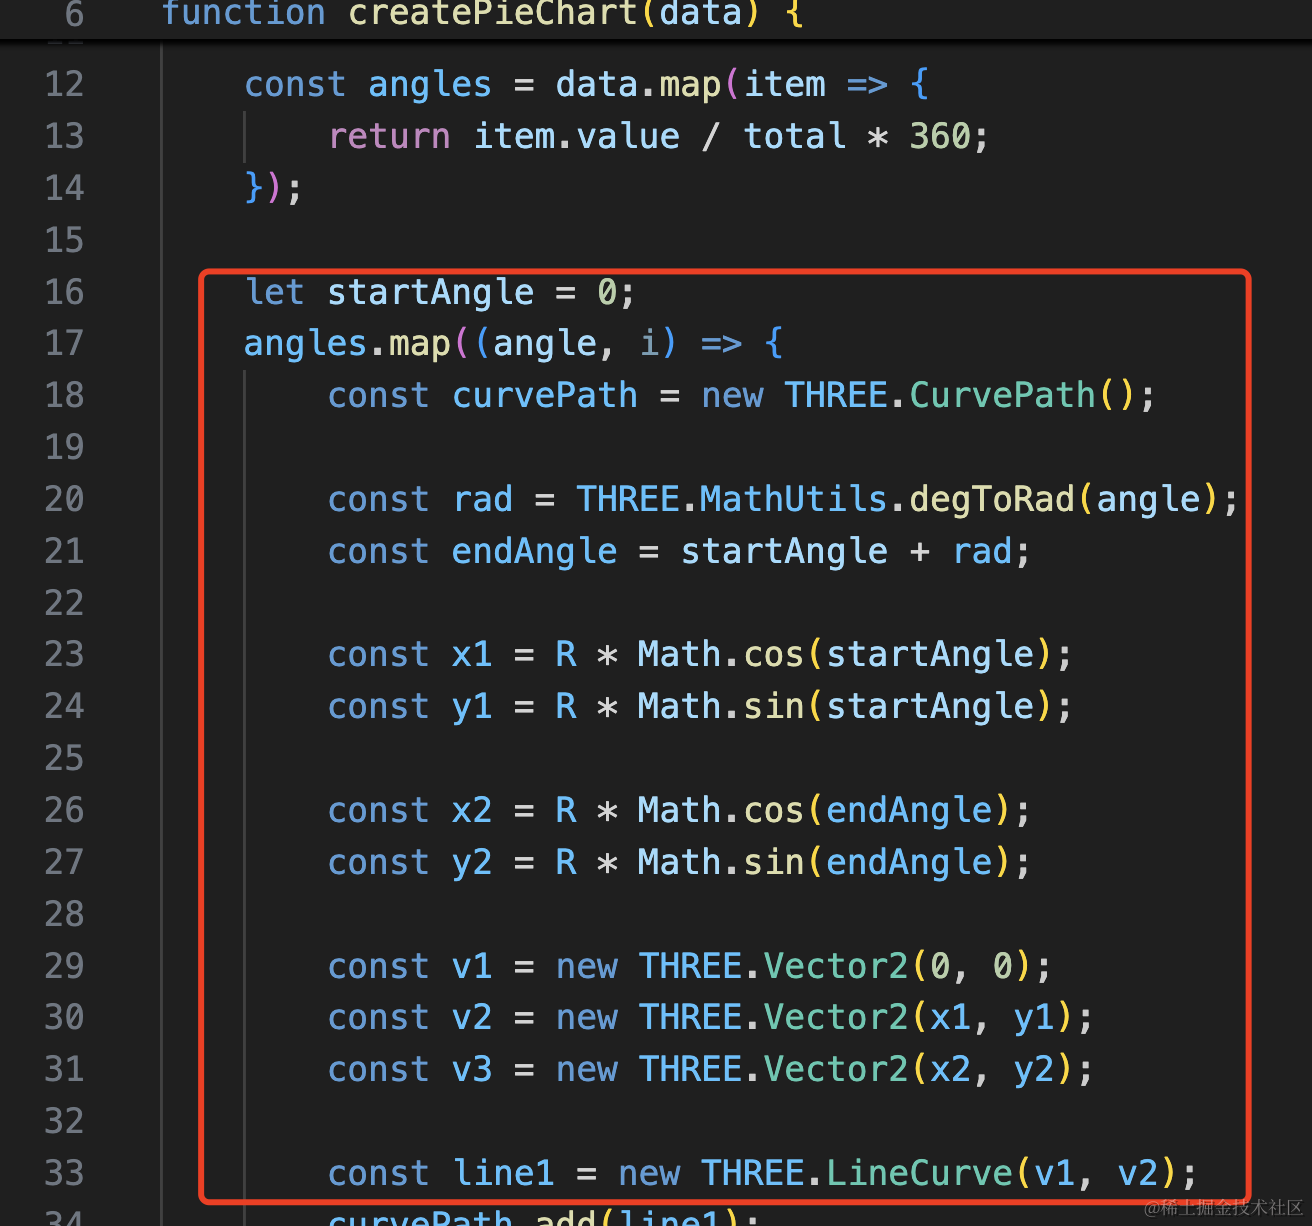
let startAngle = 0;
angles.map((angle, i) => {
    const curvePath = new THREE.CurvePath();

    const rad = THREE.MathUtils.degToRad(angle);
    const endAngle = startAngle + rad;

    const x1 = R * Math.cos(startAngle);
    const y1 = R * Math.sin(startAngle);

    const x2 = R * Math.cos(endAngle);
    const y2 = R * Math.sin(endAngle);

    const v1 = new THREE.Vector2(0, 0);
    const v2 = new THREE.Vector2(x1, y1);
    const v3 = new THREE.Vector2(x2, y2);

    const line1 = new THREE.LineCurve(v1, v2);
    curvePath.add(line1);

    const arc = new THREE.EllipseCurve(0, 0, R, R, startAngle, endAngle);
    curvePath.add(arc);

    const line2 = new THREE.LineCurve(v1, v3);
    curvePath.add(line2);

    const points = curvePath.getPoints(100);
    const shape = new THREE.Shape(points);

    const geometry = new THREE.ExtrudeGeometry(shape, {
        depth: 100
    })
    const material = new THREE.MeshPhongMaterial({
        color: getRandomColor()
    });

    const mesh = new THREE.Mesh(geometry, material);
    group.add(mesh);

    startAngle += rad;
})
有了角度,只需要按照这个角度把饼图的每个部分画出来就行。
首先用 MathUtils.degToRad 把角度转为弧度制。
开始角度从 0 开始,结束角度就是加上当前的角度。
然后分别通过两条直线一条弧线把形状画出来之后,用 ExtrudeGeometry 拉伸下。
两条直线的 x、y 是通过 cos、sin 算出来的。
下个饼图的 part 的开始角度要加上已经画过的角度。
试下效果:
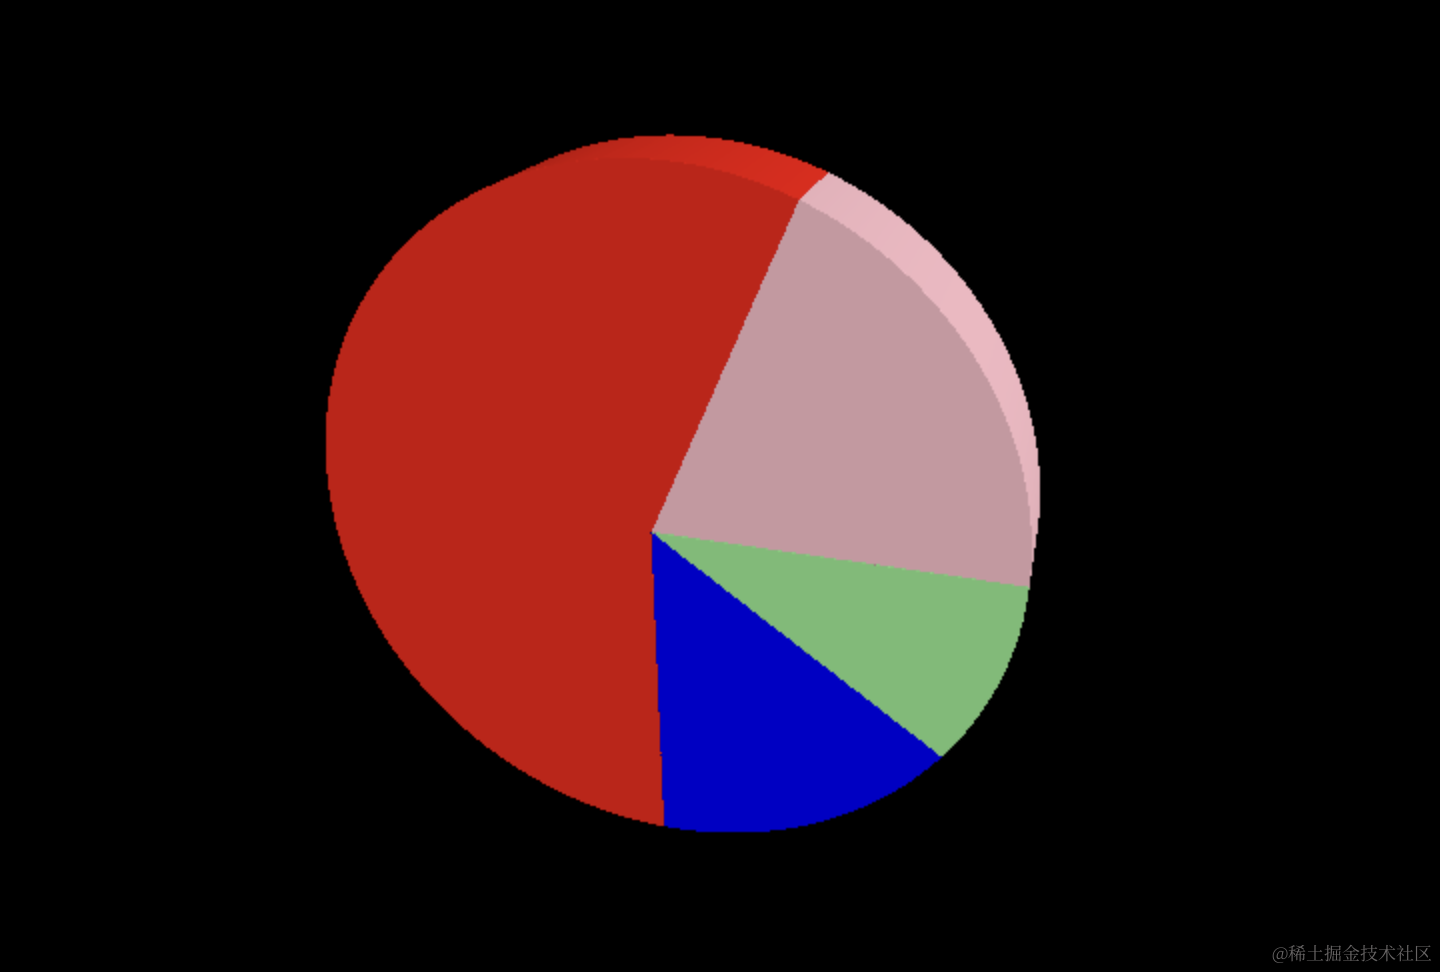
没啥问题。
然后把它旋转一下:
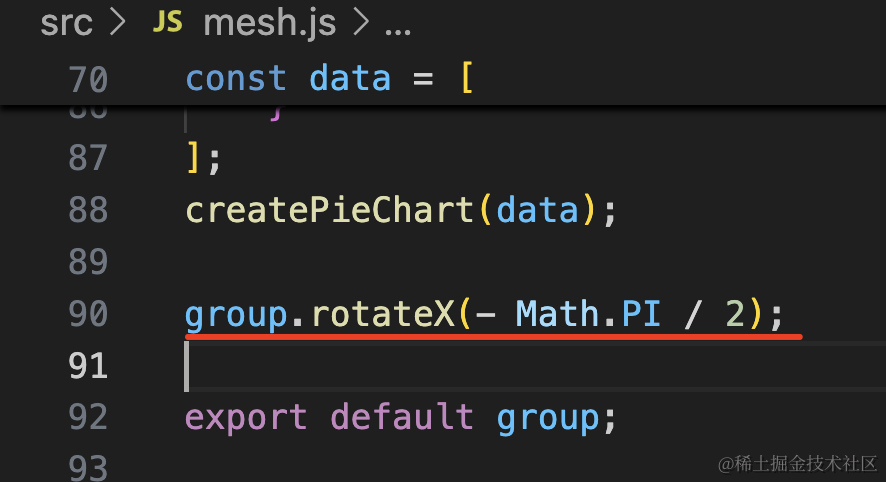
group.rotateX(- Math.PI / 2);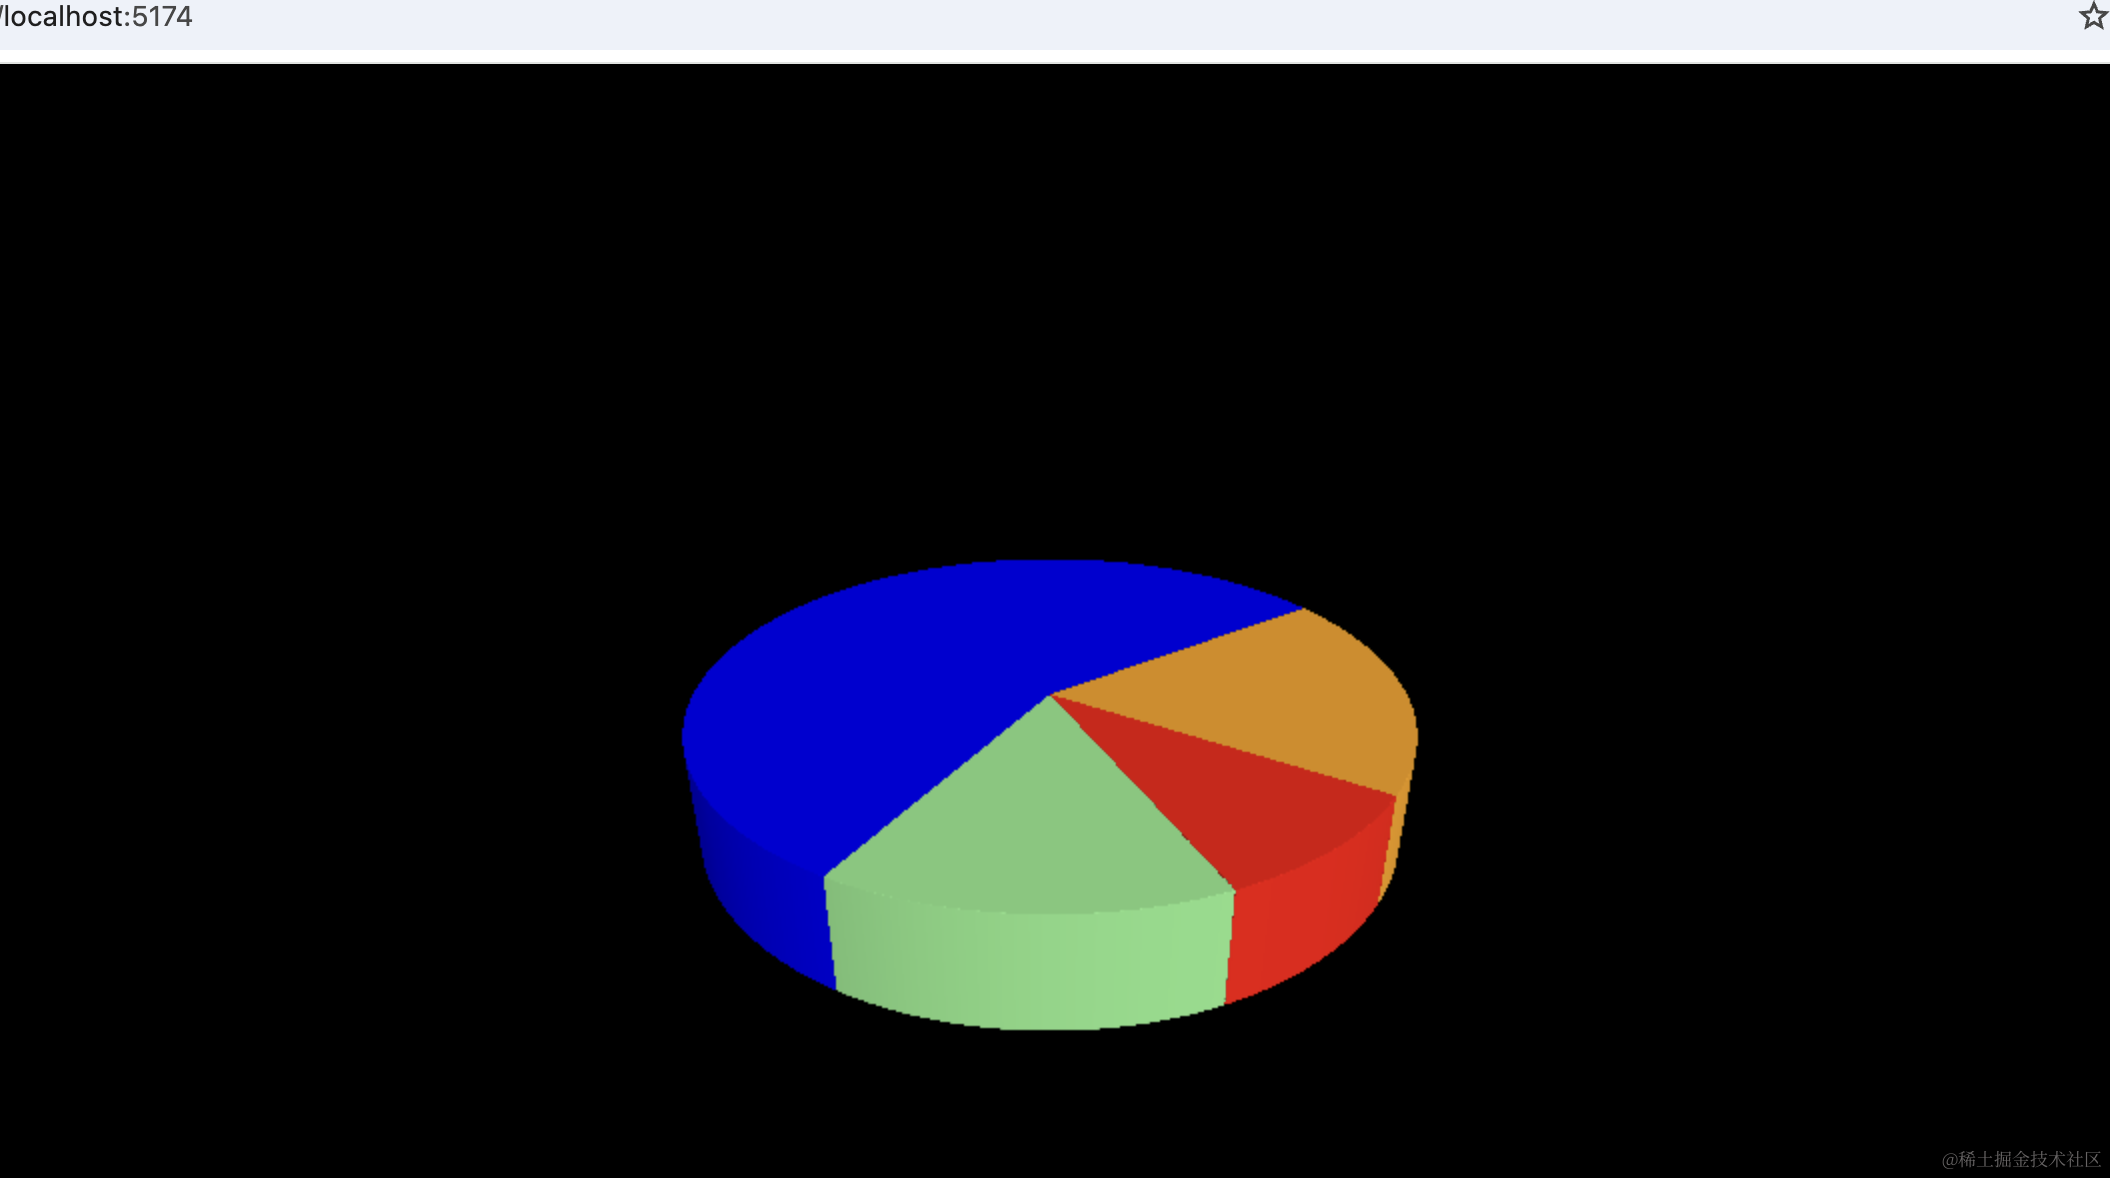
这样,饼图的形状就画好了。
案例代码上传了小册仓库。
总结
这节我们把饼图画了出来。
用 CurvePath 来组合曲线路径,用到了两个 LineCurve 和一个 EllipseCurve 来画形状,曲线取点构造 Shape,之后用 ExtrudeGeometry 拉伸成几何体。
CurvePath 曲线连接的顺序很重要,要从一个点开始,最后回到原点,顺序不能错。
难点在于角度的计算,需要根据当前值和 total 的比例计算角度,然后用 MathUtils.degToRad 转为弧度制,这样就确定了每个 part 的旋转角度和大小。
形状画出来了,下节我们给它加上交互。