前面做的都是平面地图上的可视化:
有的时候我们需要在球面上做可视化效果。
比如这样:

那如何把经纬度转成三维空间球面上的坐标呢?
记得我们是如何把经纬度转成平面坐标的么?
是用墨卡托投影。
而这里也有对应的算法。
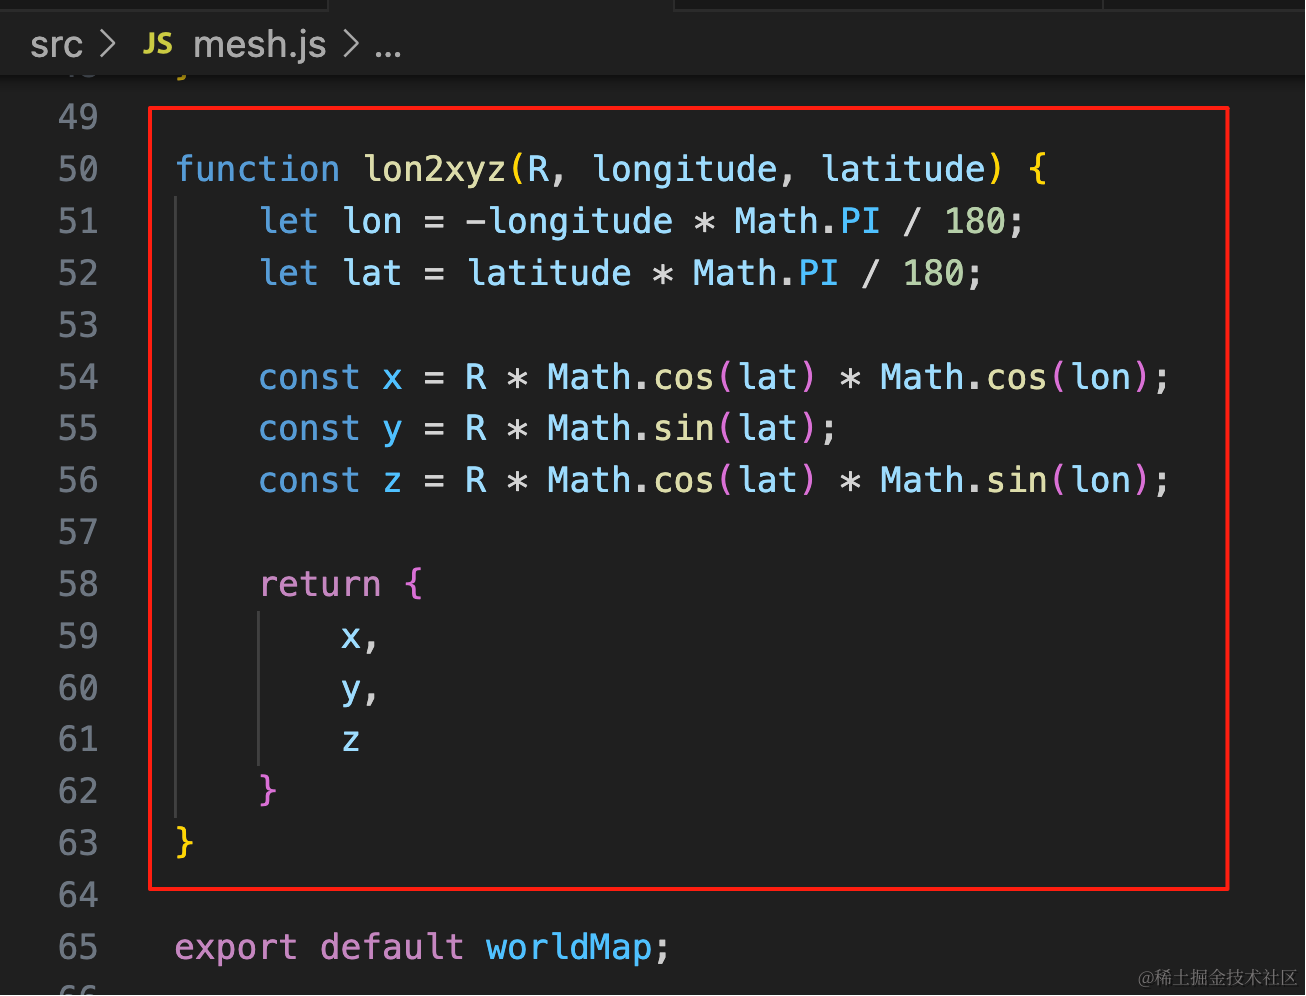
我们不需要理解如何转换,直接用就行。
function lon2xyz(R, longitude, latitude) {
    let lon = -longitude * Math.PI / 180;
    let lat = latitude * Math.PI / 180;

    const x = R * Math.cos(lat) * Math.cos(lon);
    const y = R * Math.sin(lat);
    const z = R * Math.cos(lat) * Math.sin(lon);

    return {
        x,
        y,
        z
    }
}
就像你用墨卡托投影的时候,去了解它的原理了么?没有,这里当然也不用了解原理。
我们来写一下:
npx create-vite spherical-world-map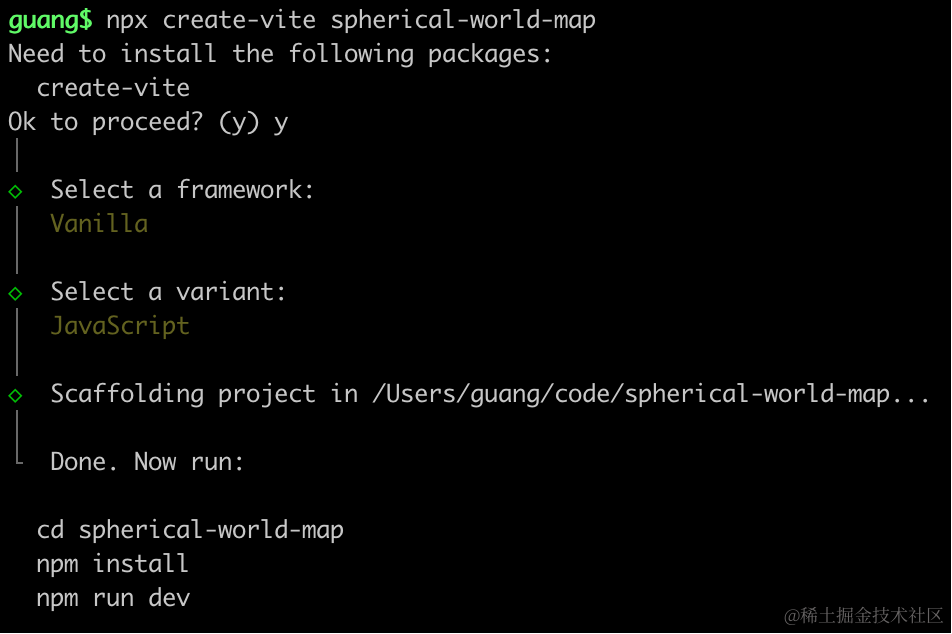
创建项目,进入项目,安装依赖:
pnpm install
pnpm install --save three
pnpm install --save-dev @types/three
改下 src/main.js
import './style.css';
import * as THREE from 'three';
import {
    OrbitControls
} from 'three/addons/controls/OrbitControls.js';
import mesh from './mesh.js';

const scene = new THREE.Scene();

scene.add(mesh);

const light = new THREE.DirectionalLight(0xffffff);
light.position.set(500, 300, 600);
scene.add(light);

const light2 = new THREE.AmbientLight();
scene.add(light2);

const axesHelper = new THREE.AxesHelper(1000);
scene.add(axesHelper);

const width = window.innerWidth;
const height = window.innerHeight;

const camera = new THREE.PerspectiveCamera(60, width / height, 1, 10000);
camera.position.set(0, 200, 600);
camera.lookAt(0, 0, 0);

const renderer = new THREE.WebGLRenderer({
  antialias: true
});
renderer.setSize(width, height)

function render() {
    renderer.render(scene, camera);
    requestAnimationFrame(render);
}

render();

document.body.append(renderer.domElement);

const controls = new OrbitControls(camera, renderer.domElement);
创建 Scene、Light、Camera、Renderer
改下 style.css
body {
    margin: 0;
}
然后创建 mesh.js
import * as THREE from 'three';

const worldMap = new THREE.Group();


export default worldMap;
跑一下:
npm run dev
这次我们画世界地图:
从这里下载 geojson:
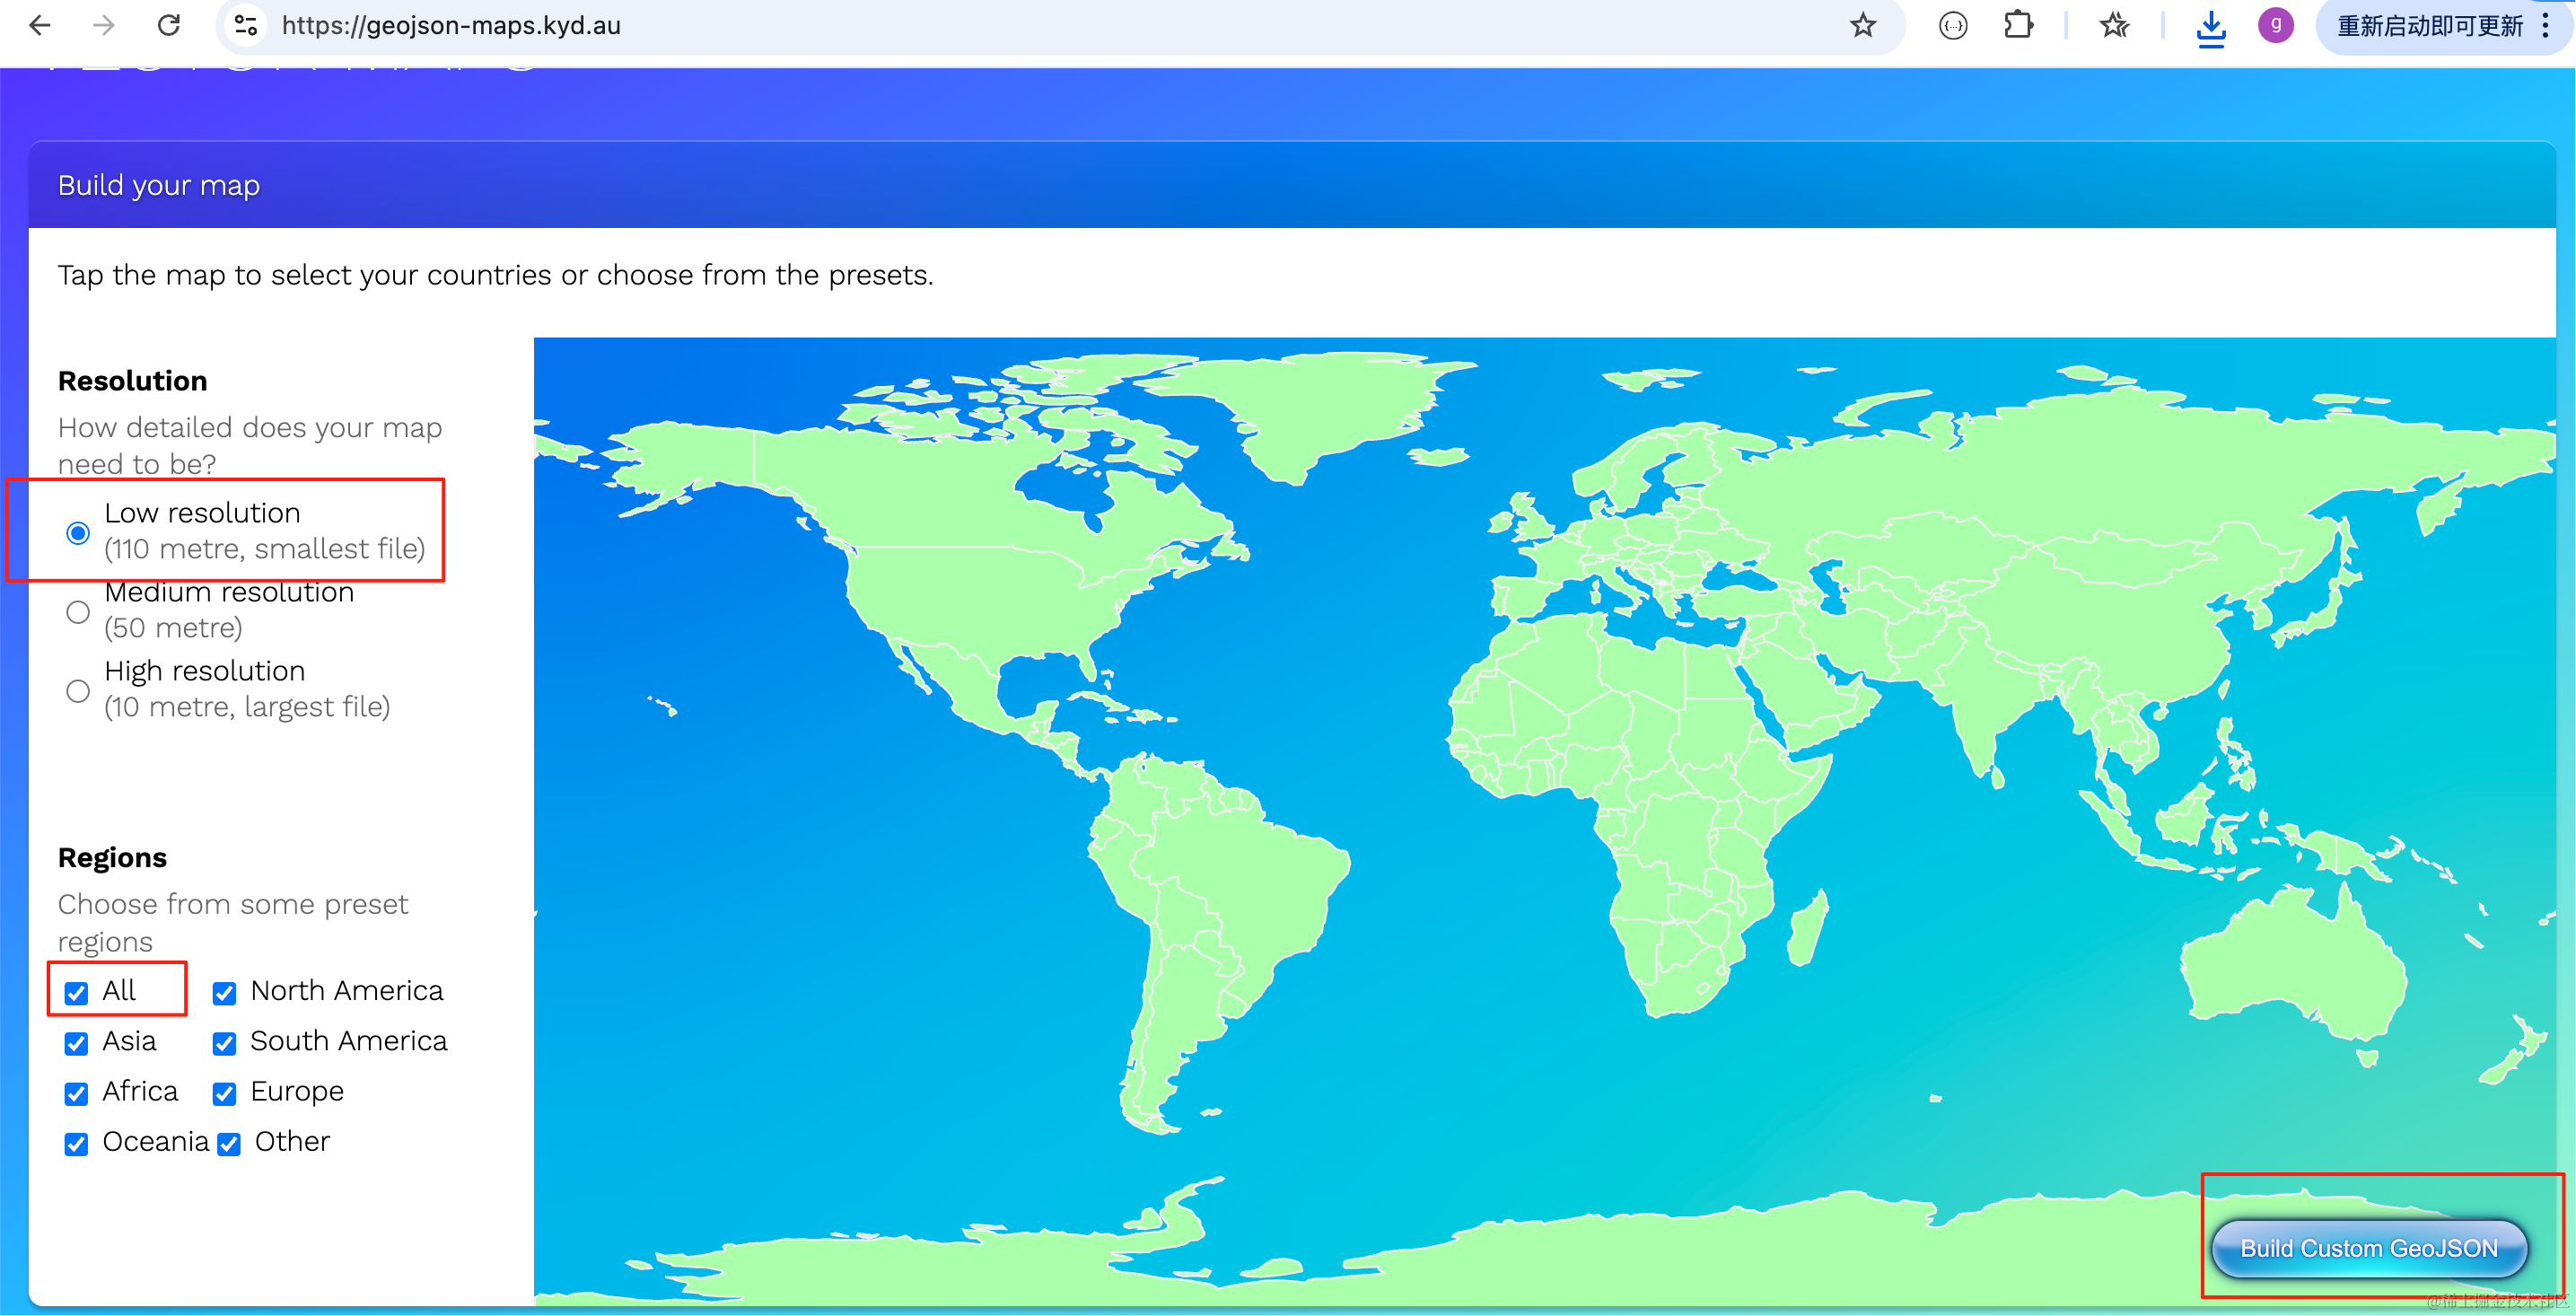
选择低分辨率、全部地区,然后点击右下角的按钮下载 geojson。
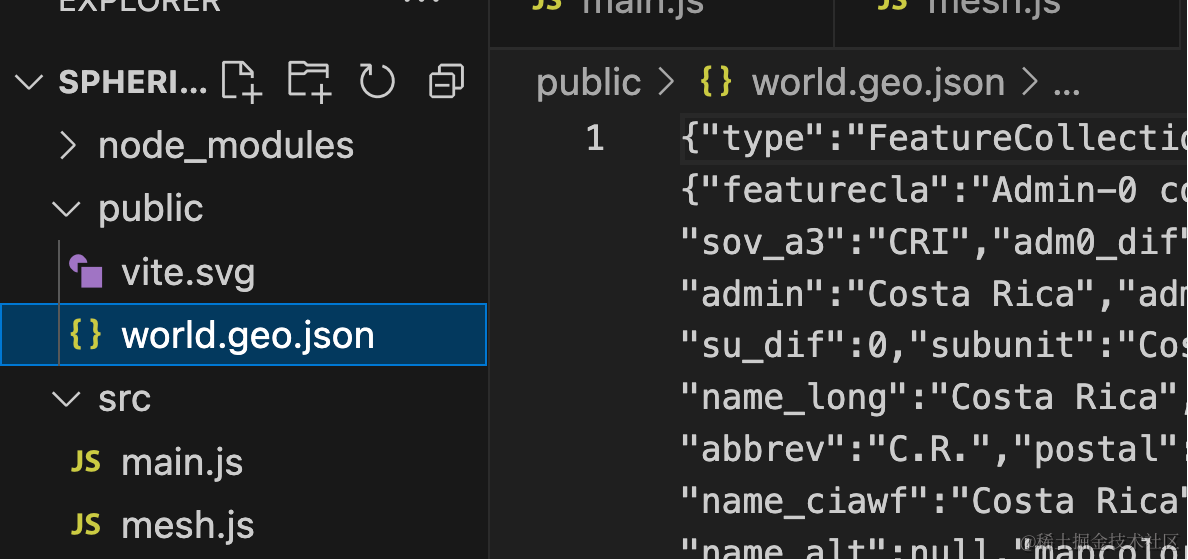
把它放到 public 目录下:
我们先用墨卡托投影在平面上把它画出来:
安装下 d3-geo
pnpm install --save d3-geo
pnpm install --save-dev @types/d3-geo
和之前画中国地图一样:
import * as THREE from 'three';
import { geoMercator } from 'd3-geo';

const worldMap = new THREE.Group();

const mercator = geoMercator()
    .center([105,34]).translate([0, 0]).scale(100)

const loader = new THREE.FileLoader();
loader.load('./world.geo.json', function (data) {
    const geojson = JSON.parse(data);
    console.log(geojson);

    geojson.features.forEach(feature => {
        const province = new THREE.Group();

        if (feature.geometry.type === 'Polygon') {
            const polygon = createPolygon(feature.geometry.coordinates);
            province.add(polygon);
        } else if (feature.geometry.type === 'MultiPolygon') {
            feature.geometry.coordinates.forEach(polygonCoords => {
                const polygon = createPolygon(polygonCoords);
                province.add(polygon);
            });
        }

        worldMap.add(province);
    });
});

function createPolygon(coordinates) {
    const group = new THREE.Group();

    coordinates.forEach(item => {
        const bufferGeometry = new THREE.BufferGeometry();
        const vertices = [];
        item.forEach(point => {
            const [x, y] = mercator(point);
            vertices.push(x, -y, 0);
        });
        const attribute = new THREE.Float32BufferAttribute(vertices, 3);;
        bufferGeometry.attributes.position = attribute;

        const lineMaterial = new THREE.LineBasicMaterial({
            color: 'white'
        });
        const line = new THREE.Line(bufferGeometry, lineMaterial);
        group.add(line);
    });

    return group;
}

export default worldMap;
只不过数据不一样,画法是一样的。
看下效果:
然后我们用前面那个经纬度转三维坐标的算法来算一下:
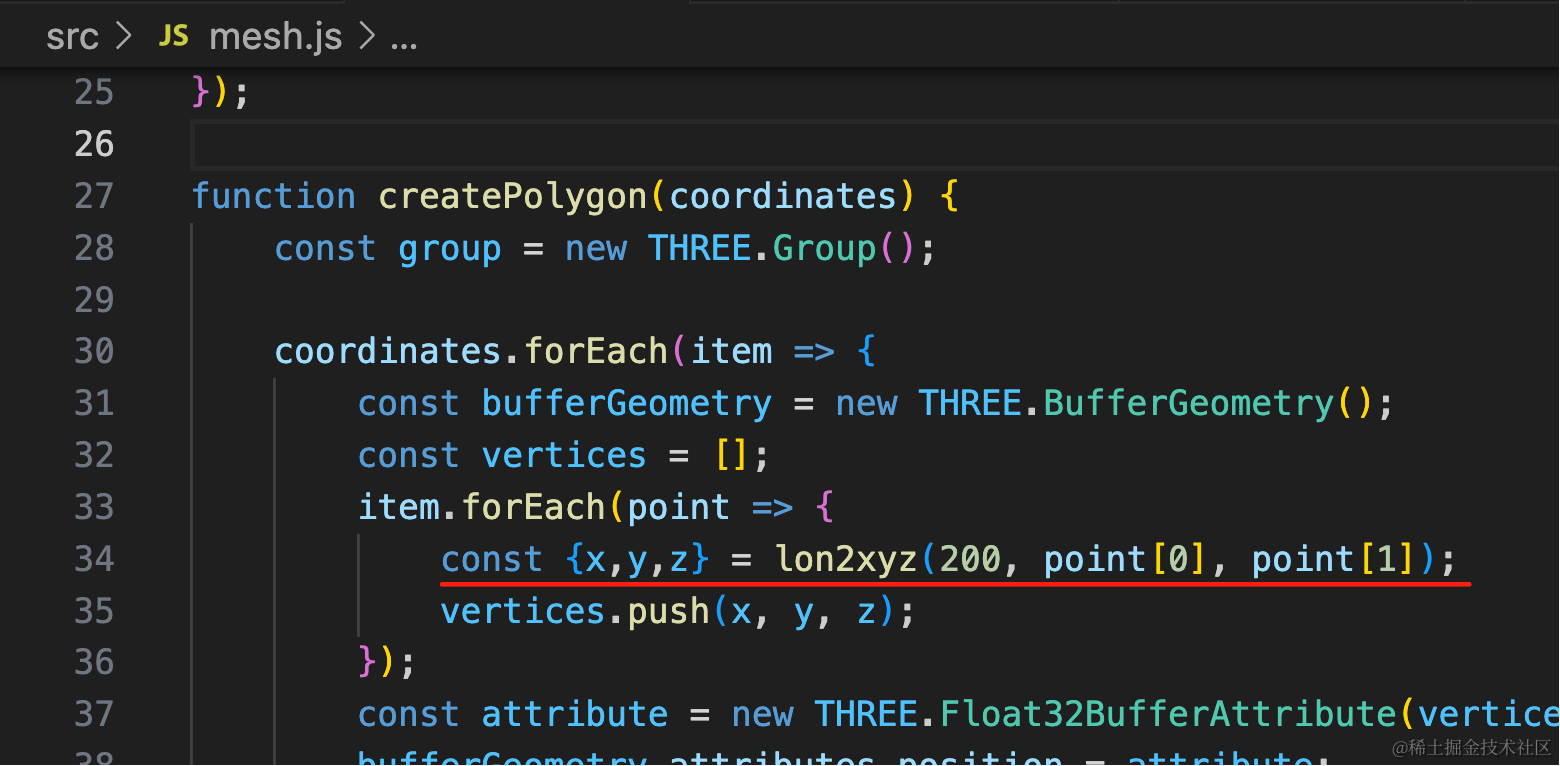
其他的不变,只不过把经纬度转二维坐标,换成了经纬度转三维坐标。
const {x,y,z} = lon2xyz(200, point[0], point[1]);function lon2xyz(R, longitude, latitude) {
let lon = -longitude * Math.PI / 180;
let lat = latitude * Math.PI / 180;
const x = R * Math.cos(lat) * Math.cos(lon);
const y = R * Math.sin(lat);
const z = R * Math.cos(lat) * Math.sin(lon);
return {
x,
y,
z
}
}看下效果:
现在就是球面上的地图效果了。
我们在下面画一个球:
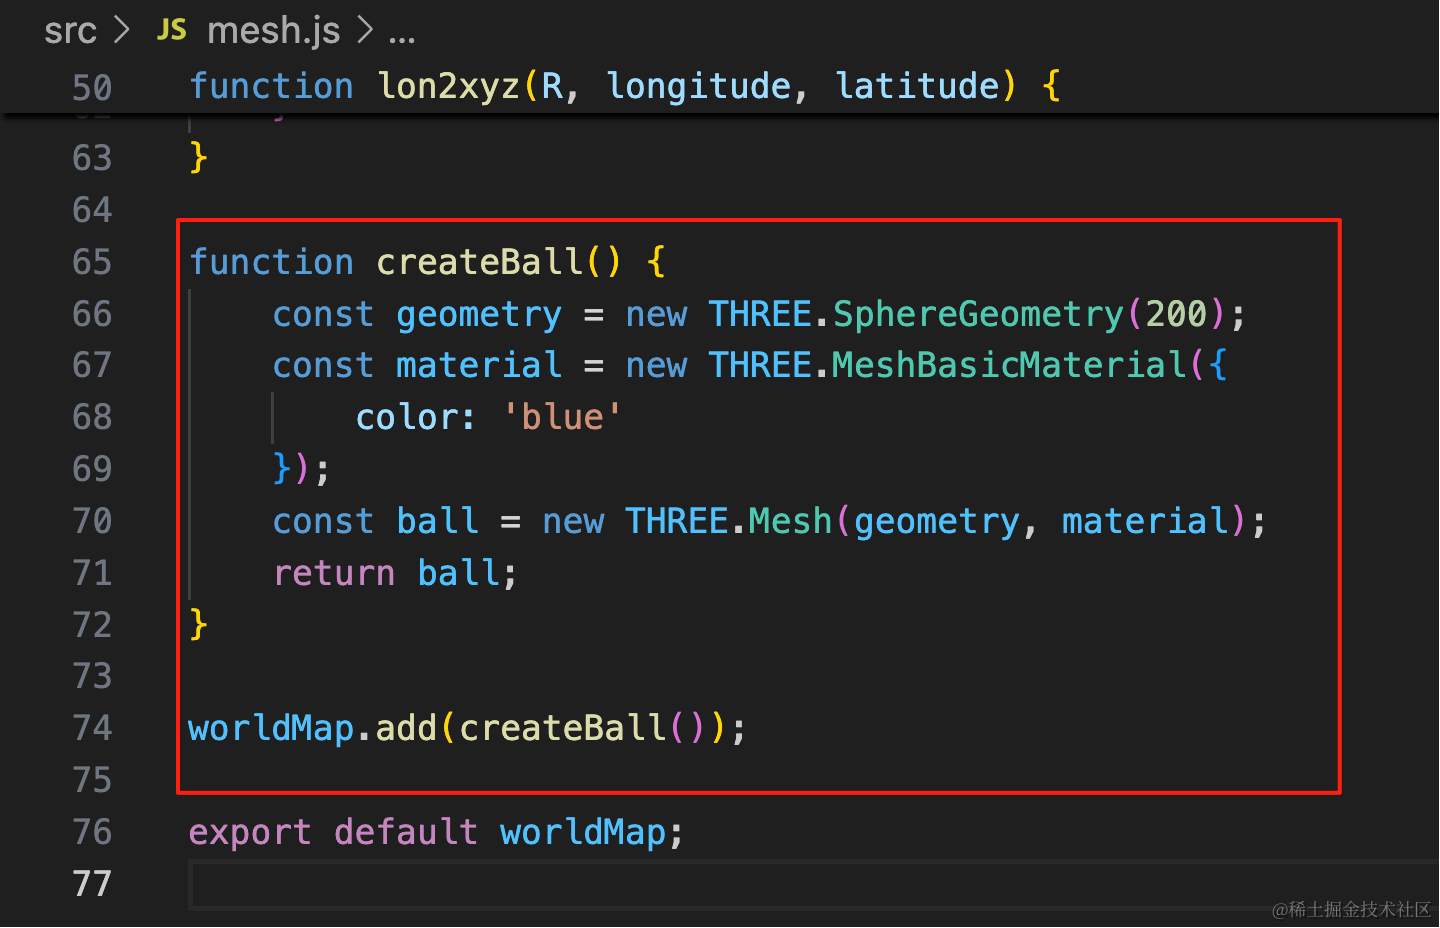
function createBall() {
    const geometry = new THREE.SphereGeometry(200);
    const material = new THREE.MeshBasicMaterial({
        color: 'blue'
    });
    const ball = new THREE.Mesh(geometry, material);
    return ball;
}

worldMap.add(createBall());
这样,地球的效果就出来了。
案例代码上传了小册仓库
总结
这节我们用 geojson 画出了地球的效果。
之前我们都是用墨卡托投影把经纬度转为平面坐标,画二维地图。
现在我们学了新的算法,来把经纬度转为球面上的三维坐标。
之前的柱子、飞线等效果,当然也可以用在这个球面上。
其实球面的地图可视化、平面的地图可视化,原理都差不多。