这节我们来做一个实战:交互式地球仪。
我们知道,地球仪上有各个国家的信息:
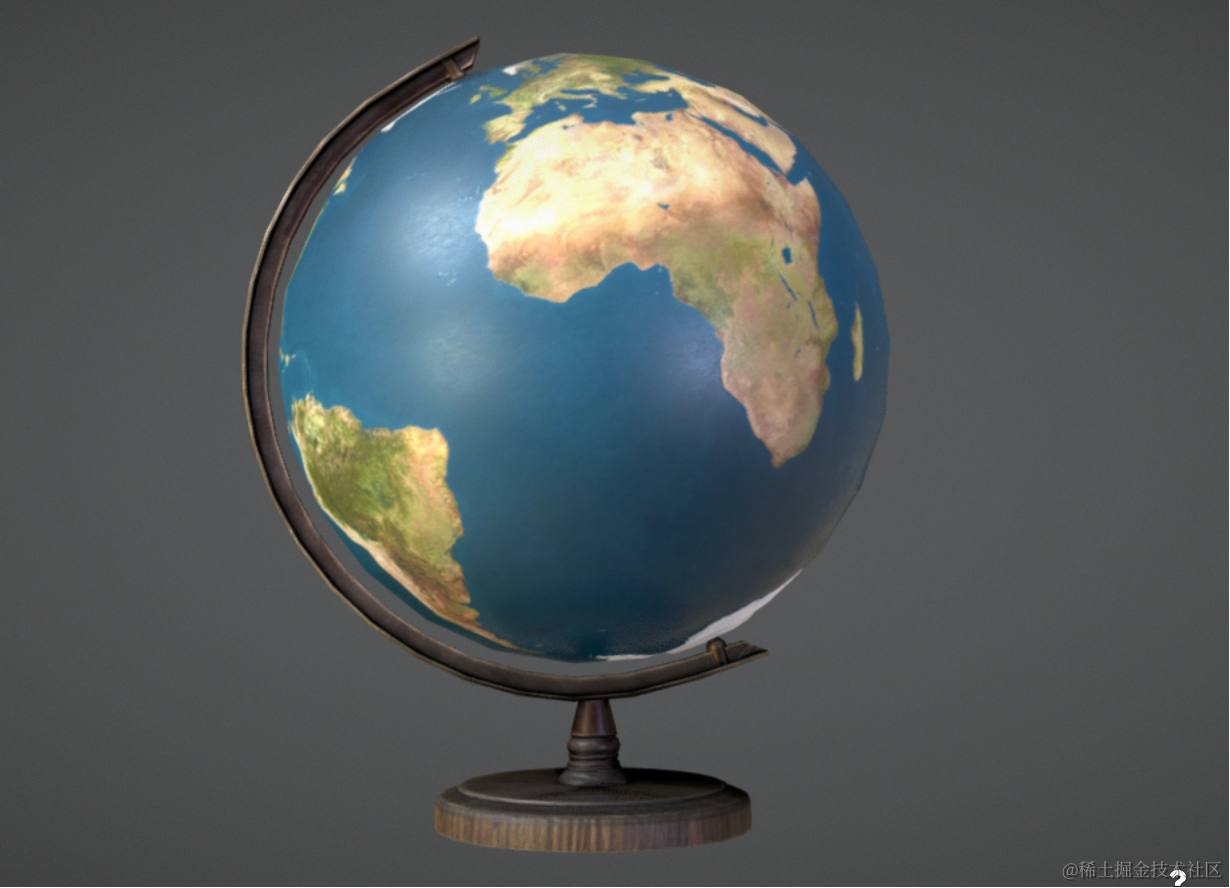
我们想找某个国家,可以转动地球仪慢慢来找。
这节我们来做一个可自动定位国家位置的地球仪。
创建项目:
npx create-vite interactive-globe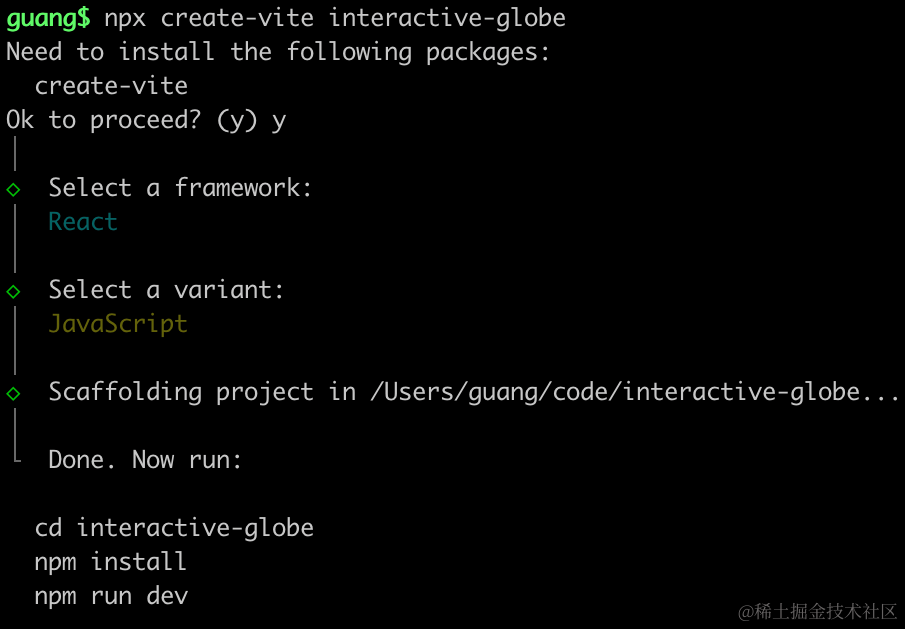
因为我们要用 div +css 来展示国家的名字,以及一个搜索框,所以选了 react 作为前端框架来开发。
进入项目,安装依赖:
pnpm install
pnpm install --save three
pnpm install --save-dev @types/three
去掉 StrictMode 和 index.css

然后改一下 App.jsx
import { useEffect, useRef, useState } from 'react';
import { init } from './3d-init'
import './App.css'

function App() {

  useEffect(() => {
    const dom = document.getElementById('content');
    const { scene } = init(dom);

    return () => {
      dom.innerHTML = '';
    }
  }, []);

  return <div>
    <div id="main">
      <div id="content">
      </div>
    </div>
  </div>
}

export default App
在 App.css 写下样式:
body {
  margin: 0;
}
然后来初始化 3d 场景:
创建 3d-init.js
import * as THREE from 'three';
import {
    OrbitControls
} from 'three/addons/controls/OrbitControls.js';
import mesh from './mesh';

export function init(dom) {

    const scene = new THREE.Scene();
    scene.add(mesh);

    const axesHelper = new THREE.AxesHelper(500);
    scene.add(axesHelper);

    const directionalLight = new THREE.DirectionalLight(0xffffff);
    directionalLight.position.set(500, 400, 300);
    scene.add(directionalLight);

    const ambientLight = new THREE.AmbientLight(0xffffff);
    scene.add(ambientLight);

    const width = window.innerWidth;
    const height = window.innerHeight;

    const camera = new THREE.PerspectiveCamera(60, width / height, 1, 10000);
    camera.position.set(0, 500, 500);
    camera.lookAt(0, 0, 0);

    const renderer = new THREE.WebGLRenderer({
        antialias: true
    });
    renderer.setSize(width, height);

    const controls = new OrbitControls(camera, renderer.domElement);

    function render(time) {
        controls.update(time);
        renderer.render(scene, camera);
        requestAnimationFrame(render);
    }

    render();

    dom.append(renderer.domElement);

    window.onresize = function () {
        const width = window.innerWidth;
        const height = window.innerHeight;

        renderer.setSize(width,height);

        camera.aspect = width / height;
        camera.updateProjectionMatrix();
    };

    return {
        scene,
        renderer,
        controls
    }
}
创建 mesh.js
import * as THREE from 'three';

const group = new THREE.Group();

const geometry = new THREE.BoxGeometry(100, 100, 100);
const material = new THREE.MeshLambertMaterial({
    color: 'orange'
});
const mesh = new THREE.Mesh(geometry, material);

group.add(mesh);

export default group;
我们先跑起来看下:
npm run dev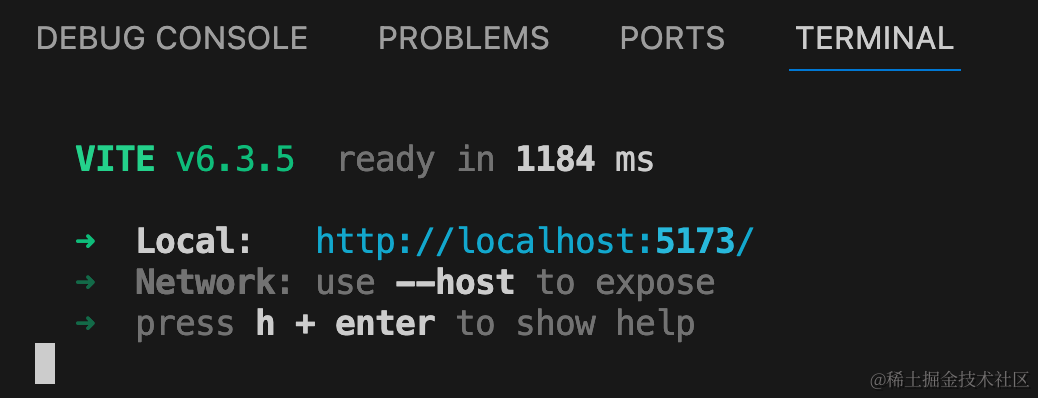
然后先把地球画出来:
改下 mesh.js
import * as THREE from 'three';

const worldMap = new THREE.Group();

const loader = new THREE.FileLoader();
loader.load('./world.geo.json', function (data) {
    const geojson = JSON.parse(data);

    geojson.features.forEach(feature => {
        const province = new THREE.Group();

        if (feature.geometry.type === 'Polygon') {
            const polygon = createPolygon(feature.geometry.coordinates);
            province.add(polygon);
        } else if (feature.geometry.type === 'MultiPolygon') {
            feature.geometry.coordinates.forEach(polygonCoords => {
                const polygon = createPolygon(polygonCoords);
                province.add(polygon);
            });
        }

        worldMap.add(province);
    });
});

function createPolygon(coordinates) {
    const group = new THREE.Group();

    coordinates.forEach(item => {
        const bufferGeometry = new THREE.BufferGeometry();
        const vertices = [];
        item.forEach(point => {
            const {x,y,z} = lon2xyz(300, point[0], point[1]);
            vertices.push(x, y, z);
        });
        const attribute = new THREE.Float32BufferAttribute(vertices, 3);;
        bufferGeometry.attributes.position = attribute;

        const lineMaterial = new THREE.LineBasicMaterial({
            color: 'blue'
        });
        const line = new THREE.Line(bufferGeometry, lineMaterial);
        group.add(line);
    });

    return group;
}

function lon2xyz(R, longitude, latitude) {
    let lon = -longitude * Math.PI / 180;
    let lat = latitude * Math.PI / 180;

    const x = R * Math.cos(lat) * Math.cos(lon);
    const y = R * Math.sin(lat);
    const z = R * Math.cos(lat) * Math.sin(lon);

    return {
        x,
        y,
        z
    }
}

function createBall() {
    const geometry = new THREE.SphereGeometry(300);
    const material = new THREE.MeshBasicMaterial({
        color: 'white'
    });
    const ball = new THREE.Mesh(geometry, material);
    return ball;
}

worldMap.add(createBall());

export default worldMap;
这是上节的代码,就不展开解释了。
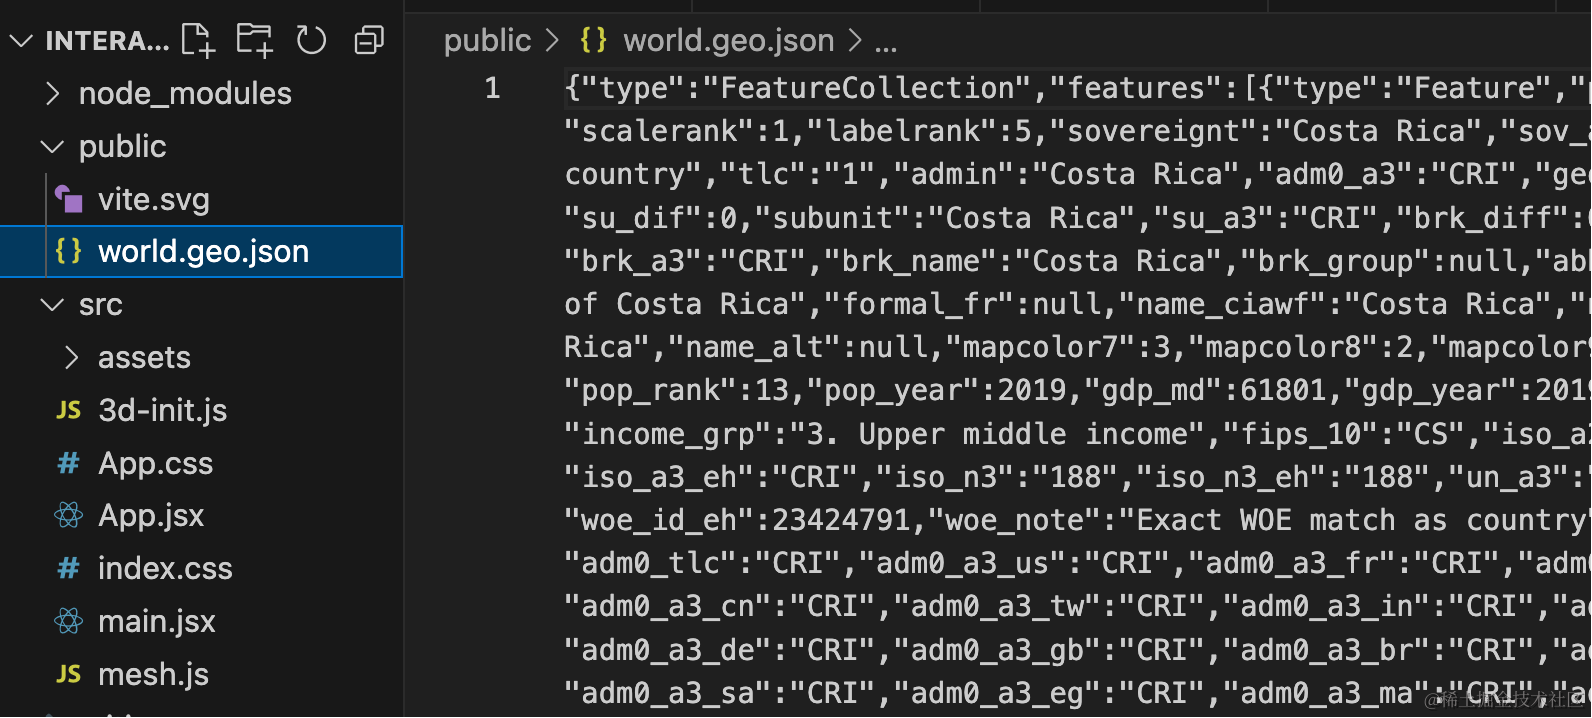
还是从这里下载世界地图的 geojson
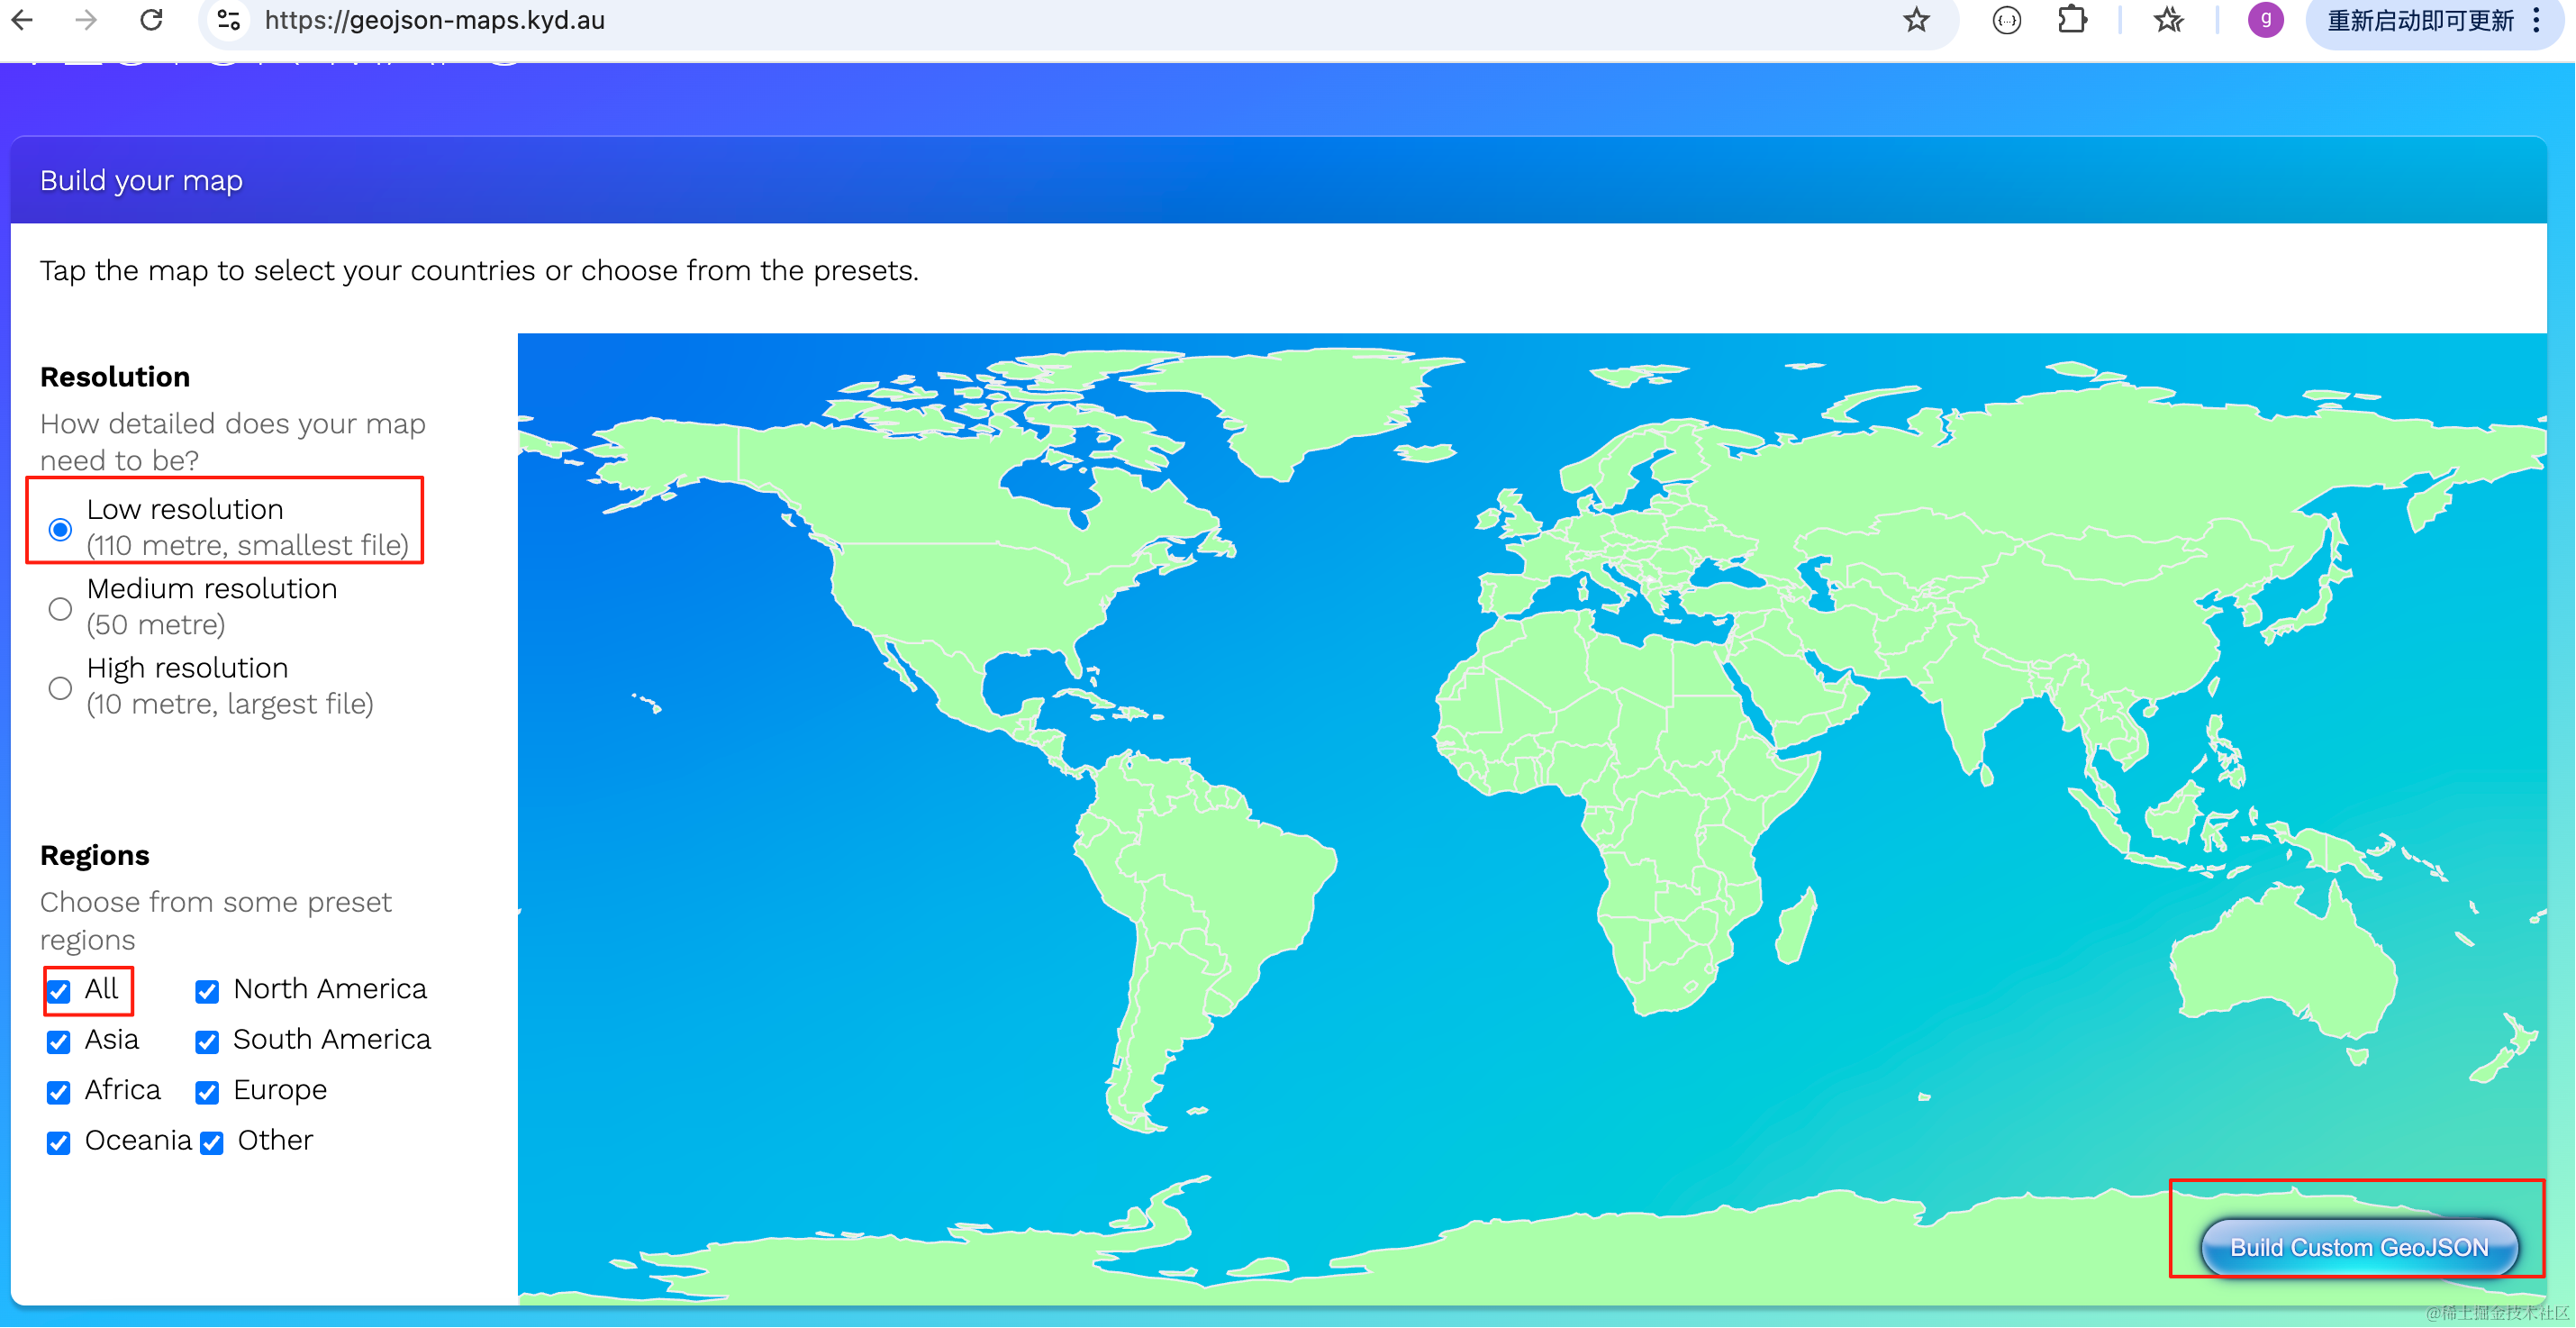
放 pulic 目录下:
看下效果:
但只有轮廓线太单调了。
如何让国家轮廓内有背景呢?
找张贴图就好了:
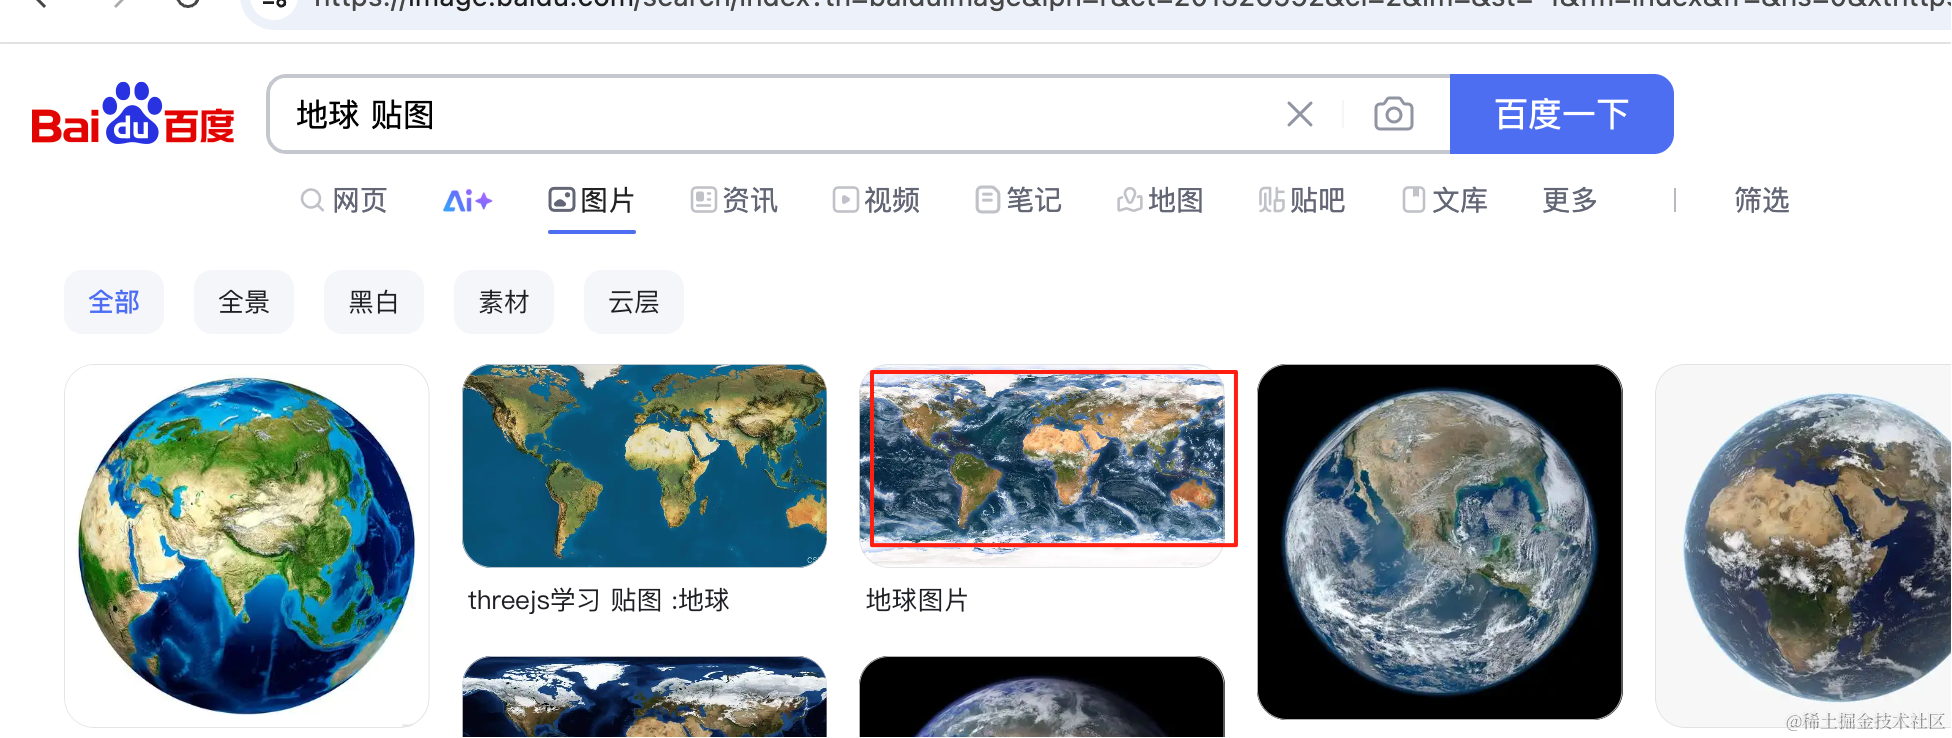
下载放到 public 目录下:

代码里加载下:
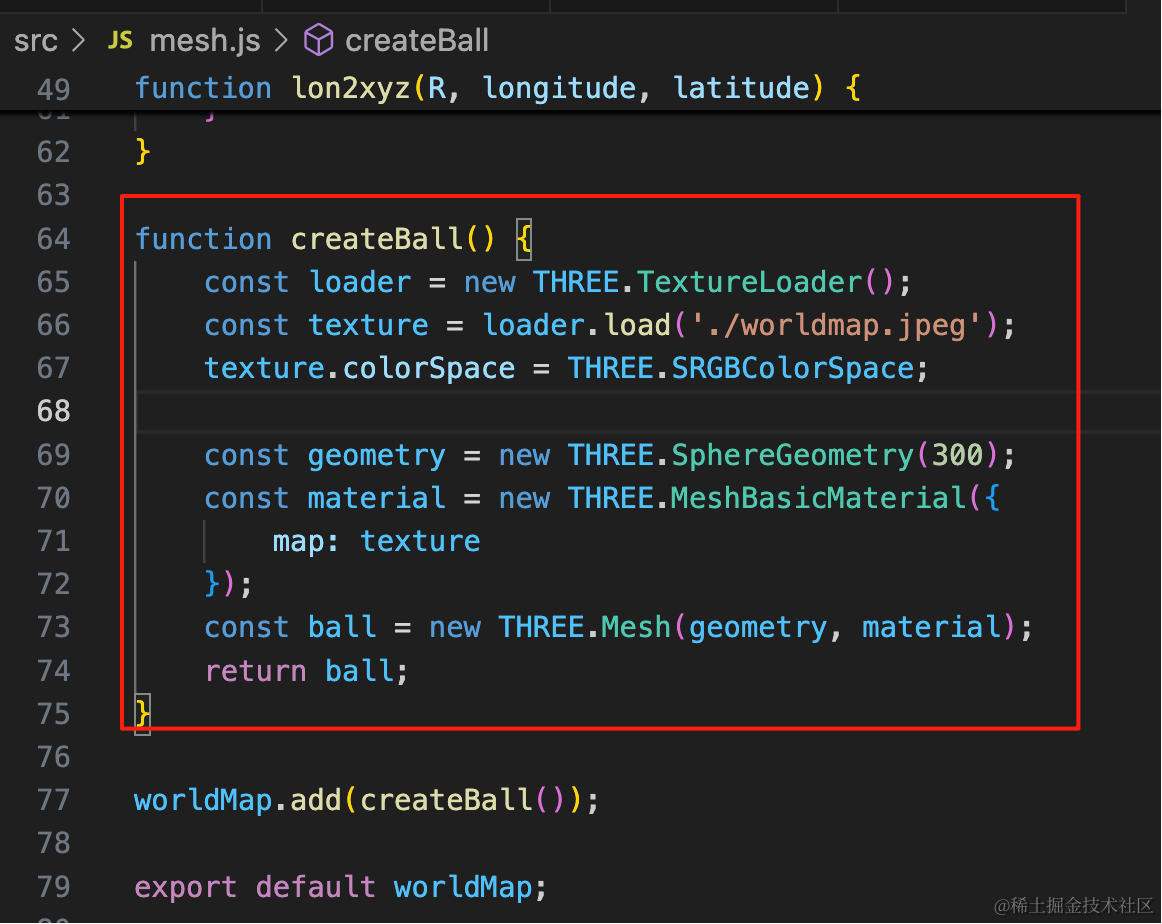
function createBall() {
    const loader = new THREE.TextureLoader();
    const texture = loader.load('./worldmap.jpeg');
    texture.colorSpace = THREE.SRGBColorSpace;

    const geometry = new THREE.SphereGeometry(300);
    const material = new THREE.MeshBasicMaterial({
        map: texture
    });
    const ball = new THREE.Mesh(geometry, material);
    return ball;
}
看下效果:
可以看到,纹理贴图的国家背景和我们绘制的轮廓线都严丝合缝的。
因为都是根据经纬度来的,所以自然能对上。
改一下线的颜色:
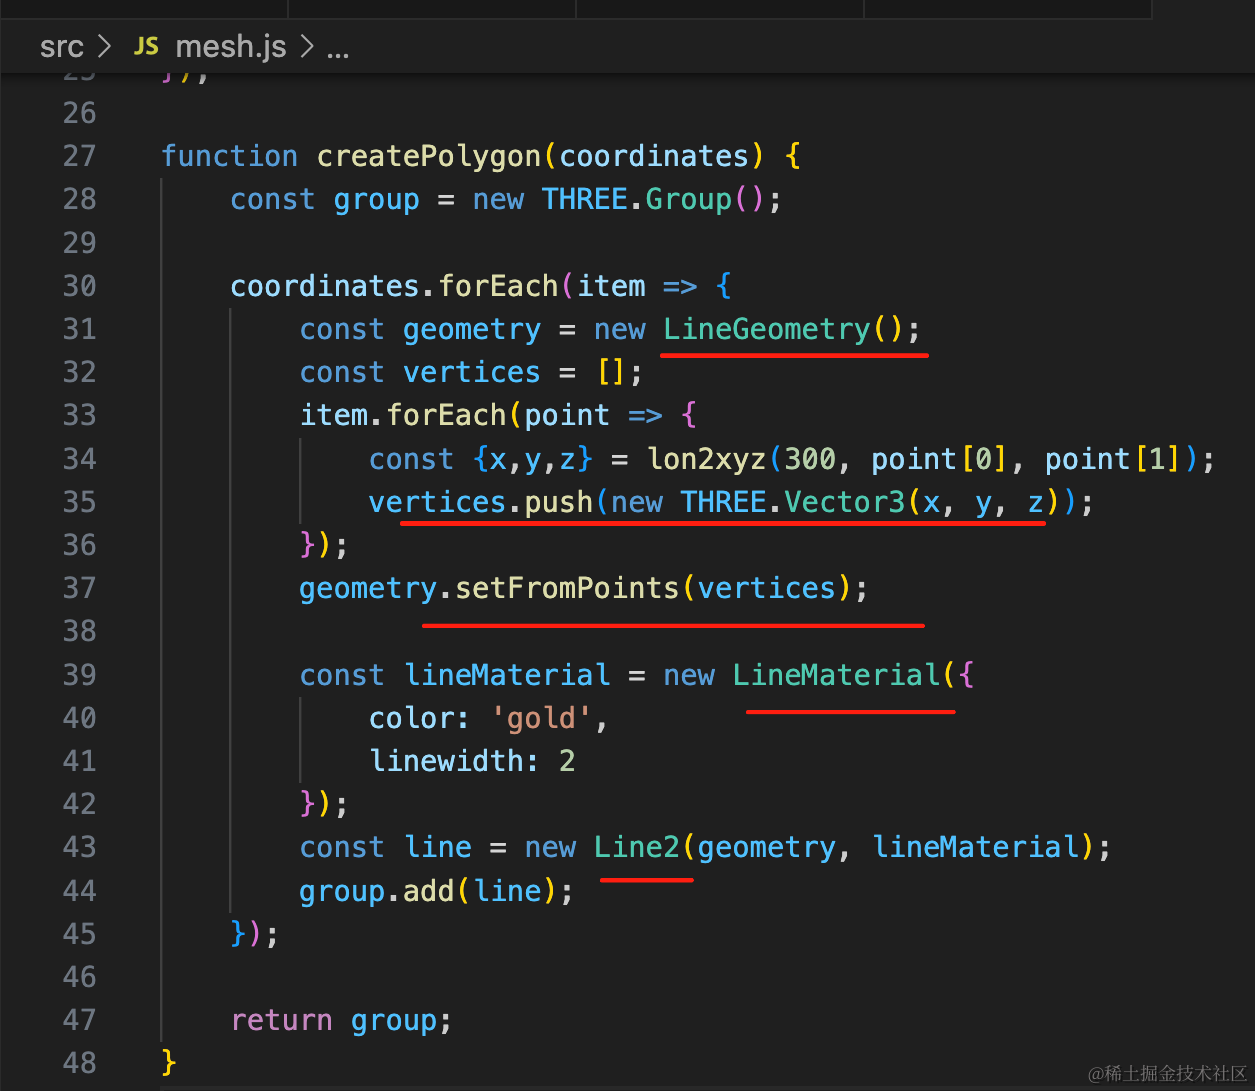
我这里把 BufferGeometry + Line 换成了 LineGeometry + Line2,这样可以设置线宽。
function createPolygon(coordinates) {
    const group = new THREE.Group();

    coordinates.forEach(item => {
        const geometry = new LineGeometry();
        const vertices = [];
        item.forEach(point => {
            const {x,y,z} = lon2xyz(300, point[0], point[1]);
            vertices.push(new THREE.Vector3(x, y, z));
        });
        geometry.setFromPoints(vertices);

        const lineMaterial = new LineMaterial({
            color: 'white',
            linewidth: 2
        });
        const line = new Line2(geometry, lineMaterial);
        group.add(line);
    });

    return group;
}
看下效果:
现在轮廓线就清晰多了。
案例代码上传了小册仓库
总结
这节我们把地球画了出来。
地球的纹理贴图 + 根据 geojson 画的国家边界线,就可以把各个国家从地球上标出来。
下节我们把国家信息详细的标识出来。